Ch. 5 - Integration
Briggs - Calculus: Early Transcendentals 3rd Edition
Briggs3rd EditionCalculus: Early TranscendentalsISBN: 9780136847243Not the one you use?Change textbook
Chapter 5, Problem 5.1.71a

Displacement from a velocity graph Consider the velocity function for an object moving along a line (see figure).
(a) Describe the motion of the object over the interval [0,6].
Graph showing velocity in m/s over time in seconds, illustrating an object's motion from 0 to 6 seconds.

Verified step by step guidance
1
Observe the velocity graph, which shows the velocity of the object (in m/s) as a function of time (in seconds). The graph consists of linear segments over the interval [0,6].
From t=0 to t=1, the velocity increases linearly from 0 m/s to 20 m/s. This indicates the object is accelerating uniformly during this time.
From t=1 to t=3, the velocity remains constant at 20 m/s. This indicates the object is moving at a constant velocity, covering equal distances in equal time intervals.
From t=3 to t=5, the velocity decreases linearly from 20 m/s to 10 m/s. This indicates the object is decelerating uniformly during this time.
From t=5 to t=6, the velocity remains constant at 10 m/s. This indicates the object is moving at a constant velocity again, but at a slower speed compared to the interval [1,3].

Verified video answer for a similar problem:

This video solution was recommended by our tutors as helpful for the problem above.
Video duration:
2m
Was this helpful?

Key Concepts

Here are the essential concepts you must grasp in order to answer the question correctly.

Velocity

Velocity is a vector quantity that describes the rate of change of an object's position with respect to time. It includes both speed and direction. In the context of the graph, the velocity values indicate how fast the object is moving at different times, which is crucial for understanding its motion.
Recommended video:
06:29
Derivatives Applied To Velocity

Displacement

Displacement is the overall change in position of an object, calculated as the area under the velocity-time graph. It can be positive, negative, or zero, depending on the direction of motion. By analyzing the graph, one can determine the total displacement over the interval [0,6] seconds by summing the areas of the shapes formed under the curve.
Recommended video:
10:17
Using The Velocity Function

Intervals of Motion

Intervals of motion refer to specific time segments during which the object's velocity remains constant or changes. In the given graph, different segments indicate periods of acceleration, constant velocity, and deceleration. Understanding these intervals helps in describing the object's motion accurately over the specified time frame.
Recommended video:
06:29
Derivatives Applied To Velocity
Related Practice
Textbook Question

{Use of Tech} Midpoint Riemann sums with a calculator Consider the following definite integrals.

(a) Write the midpoint Riemann sum in sigma notation for an arbitrary value of n.


βˆ«β‚€β΄ (4𝓍― 𝓍²) d𝓍

Textbook Question

{Use of Tech} Approximating definite integrals with a calculator Consider the following definite integrals.

(a) Write the left and right Riemann sums in sigma notation for an arbitrary value of n.


βˆ«β‚€ΒΉ cos ⁻¹ 𝓍 d𝓍

Textbook Question

Properties of integrals Consider two functions Ζ’ and g on [1,6] such that βˆ«β‚βΆΖ’(𝓍) d𝓍 = 10 and βˆ«β‚βΆg(𝓍) d𝓍 = 5, βˆ«β‚„βΆΖ’(𝓍) d𝓍 = 5 , and βˆ«β‚β΄g(𝓍) d𝓍 = 2. Evaluate the following integrals.


(a) βˆ«β‚β΄ 3f(𝓍) d𝓍

Textbook Question

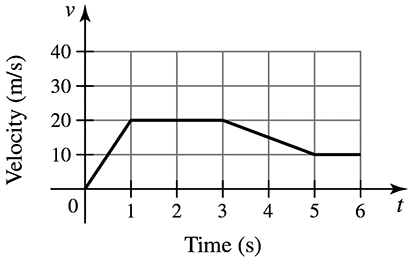
Free fall On October 14, 2012, Felix Baumgartner stepped off a balloon capsule at an altitude of almost 39 km above Earth’s surface and began his free fall. His velocity in m/s during the fall is given in the figure. It is claimed that Felix reached the speed of sound 34 seconds into his fall and that he continued to fall at supersonic speed for 30 seconds. (Source: http://www.redbullstratos.com)

(a) Divide the interval [34, 64] into n = 5 subintervals with the gridpoints xβ‚€ = 34 , x₁ = 40 , xβ‚‚ = 46 , x₃ = 52 , xβ‚„ = 58 , and xβ‚… = 64. Use left and right Riemann sums to estimate how far Felix fell while traveling at supersonic speed.

Textbook Question

Area functions The graph of Ζ’ is shown in the figure. Let A(x) = βˆ«β‚€Λ£ Ζ’(t) dt and F(x) = βˆ«β‚‚Λ£ Ζ’(t) dt be two area functions for Ζ’. Evaluate the following area functions.

(a) A(2)

1
views
Textbook Question

Area functions for the same linear function Let Ζ’(t) = 2t β€• 2 and consider the two area functions A (𝓍) = βˆ«β‚Λ£ Ζ’(t) dt and F(𝓍) = βˆ«β‚„Λ£ Ζ’(t) dt .

(a) Evaluate A (2) and A (3). Then use geometry to find an expression for A (𝓍) , for 𝓍 β‰₯ 1 .

1
views