Textbook Question
Find a. (fog) (x) b. (go f) (x). f(x) = √x, g(x) = x − 1

 Verified step by step guidance
 06:49
06:49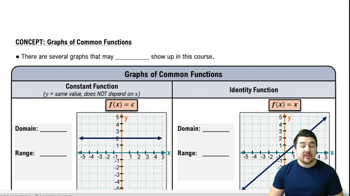 5:57
5:57 02:16
02:16Find a. (fog) (x) b. (go f) (x). f(x) = √x, g(x) = x − 1
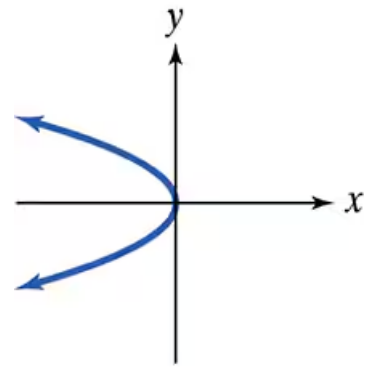
Use the vertical line test to identify graphs in which y is a function of x.
In Exercises 60–63, begin by graphing the standard quadratic function, f(x) = x2. Then use transformations of this graph to graph the given function. r(x) = -(x + 1)2
Use the vertical line test to identify graphs in which y is a function of x.
Begin by graphing the standard quadratic function, f(x) = x². Then use transformations of this graph to graph the given function. g(x) = (1/2)(x − 1)²
Find c. (fog) (2) d. (go f) (2). f(x) = √x, g(x) = x − 1