Textbook Question
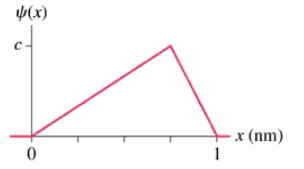
FIGURE P39.31 shows the wave function of a particle confined between x = 0 nm and x = 1.0 nm. The wave function is zero outside this region. Calculate the probability of finding the particle in the interval 0 nm ≤ x ≤ 0.25 nm.

 Verified step by step guidance
 08:30
08:30 8:13 08:30
FIGURE P39.31 shows the wave function of a particle confined between x = 0 nm and x = 1.0 nm. The wave function is zero outside this region. Calculate the probability of finding the particle in the interval 0 nm ≤ x ≤ 0.25 nm.
FIGURE P39.31 shows the wave function of a particle confined between x = 0 nm and x = 1.0 nm. The wave function is zero outside this region. Determine the value of the constant c, as defined in the figure.
Consider the electron wave function where x is in cm. Draw a graph of ψ(x) over the interval −2 cm ≤ x ≤ 2 cm. Provide numerical scales on both axes.
An experiment finds electrons to be uniformly distributed over the interval 0 cm ≤ x ≤ 2 cm, with no electrons falling outside this interval. If 106 electrons are detected, how many will be detected in the interval 0.79 to 0.81 cm?
Consider the electron wave function where x is in cm. Determine the normalization constant c.
An experiment finds electrons to be uniformly distributed over the interval 0 cm ≤ x ≤ 2 cm, with no electrons falling outside this interval. What is the probability density at x = 0.80 cm?