Textbook Question
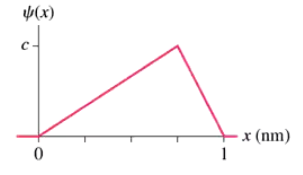
FIGURE P39.31 shows the wave function of a particle confined between x = 0 nm and x = 1.0 nm. The wave function is zero outside this region. Calculate the probability of finding the particle in the interval 0 nm ≤ x ≤ 0.25 nm.

 Verified step by step guidance
 08:30
08:30 08:17
08:17 03:59
03:59FIGURE P39.31 shows the wave function of a particle confined between x = 0 nm and x = 1.0 nm. The wave function is zero outside this region. Calculate the probability of finding the particle in the interval 0 nm ≤ x ≤ 0.25 nm.
Consider a single-slit diffraction experiment using electrons. (Single-slit diffraction was described in Section 33.4.) Using Figure 39.5 as a model, draw A graph of |ψ(x)|2 for the electrons on the detection screen.
FIGURE P39.31 shows the wave function of a particle confined between x = 0 nm and x = 1.0 nm. The wave function is zero outside this region. Draw a graph of the probability density P(x)=|ψ(x)|2
An experiment finds electrons to be uniformly distributed over the interval 0 cm ≤ x ≤ 2 cm, with no electrons falling outside this interval. If 106 electrons are detected, how many will be detected in the interval 0.79 to 0.81 cm?
Consider the electron wave function where x is in cm. Determine the normalization constant c.
An experiment finds electrons to be uniformly distributed over the interval 0 cm ≤ x ≤ 2 cm, with no electrons falling outside this interval. What is the probability density at x = 0.80 cm?