Textbook Question
Each of the following graphs is obtained from the graph of ƒ(x)=|x| or g(x)=√x by applying several of the transformations discussed in this section. Describe the transformations and give an equation for the graph.

 Verified step by step guidance
 02:44
02:44 02:16
02:16 4:26
4:26Each of the following graphs is obtained from the graph of ƒ(x)=|x| or g(x)=√x by applying several of the transformations discussed in this section. Describe the transformations and give an equation for the graph.
Describe how the graph of each function can be obtained from the graph of ƒ(x) = |x|. g(x) = -|x|
Let ƒ(x) = 3x -4. Find an equation for each reflection of the graph of ƒ(x). across the y-axis
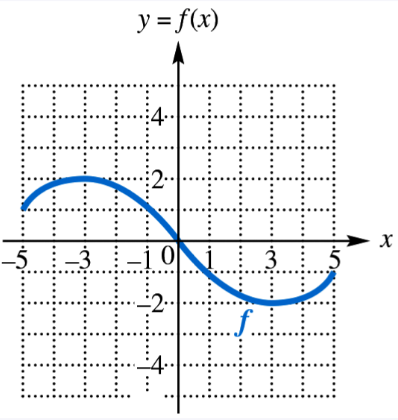
For each function graphed, give the minimum and maximum values of ƒ(x) and the x-values at which they occur.
Let ƒ(x) = 3x -4. Find an equation for each reflection of the graph of ƒ(x). across the x-axis
Each of the following graphs is obtained from the graph of ƒ(x)=|x| or g(x)=√x by applying several of the transformations discussed in this section. Describe the transformations and give an equation for the graph.