Ch. 6 - Confidence Intervals
Larson - Elementary Statistics: Picturing the World 8th Edition
Larson8th EditionElementary Statistics: Picturing the WorldISBN: 9780137493470Not the one you use?Change textbook
Chapter 6, Problem 6.2.25a

Constructing a Confidence Interval In Exercises 25–28, use the data set to (a) find the sample mean. Assume the population is normally distributed.
SAT Scores The SAT scores of 12 randomly selected high school seniors
Table displaying SAT scores of 12 randomly selected high school seniors for statistical analysis.

Verified step by step guidance
1
Step 1: Identify the data set provided. The SAT scores of 12 randomly selected high school seniors are: 1130, 1290, 1010, 1320, 950, 1250, 1340, 1100, 1260, 1180, 1470, and 920.
Step 2: Calculate the sample mean. To do this, sum all the SAT scores and divide by the total number of scores (n = 12). Use the formula: x=xin, where xi is the sum of all scores and n is the sample size.
Step 3: Assume the population is normally distributed, which is a key condition for constructing a confidence interval.
Step 4: To construct the confidence interval, calculate the sample standard deviation using the formula: s=(xi-x)2n-1, where x is the sample mean and n is the sample size.
Step 5: Use the sample mean and standard deviation to calculate the confidence interval. For a 95% confidence level, use the formula: x±tsn, where t is the t-score corresponding to the confidence level and degrees of freedom (df = n - 1).

Verified video answer for a similar problem:

This video solution was recommended by our tutors as helpful for the problem above.
Video duration:
1m
Was this helpful?

Key Concepts

Here are the essential concepts you must grasp in order to answer the question correctly.

Sample Mean

The sample mean is the average of a set of values, calculated by summing all the observations and dividing by the number of observations. In this context, it represents the average SAT score of the 12 randomly selected high school seniors. It is a key statistic used to summarize data and is foundational for further statistical analysis, such as constructing confidence intervals.
Recommended video:
05:11
Sampling Distribution of Sample Proportion

Confidence Interval

A confidence interval is a range of values, derived from a data set, that is likely to contain the true population parameter with a specified level of confidence, typically 95% or 99%. It provides an estimate of uncertainty around the sample mean. Understanding how to construct and interpret confidence intervals is crucial for making inferences about the population based on sample data.
Recommended video:
06:33
Introduction to Confidence Intervals

Normal Distribution

Normal distribution is a probability distribution that is symmetric about the mean, showing that data near the mean are more frequent in occurrence than data far from the mean. Many statistical methods, including the construction of confidence intervals, assume that the underlying population is normally distributed. This assumption is important for the validity of the results obtained from the sample data.
Recommended video:
06:23
Using the Normal Distribution to Approximate Binomial Probabilities
Related Practice
Textbook Question

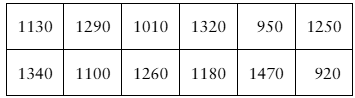
Constructing Confidence Intervals In Exercises 13–24, assume the sample is from a normally distributed population and construct the indicated confidence intervals for (a) the population variance σ^2. Interpret the results.

Drug Concentration The times (in minutes) for the drug concentration to peak when the drug epinephrine is injected into 15 randomly selected patients are listed. Use a 90% level of confidence.

Textbook Question

When all other quantities remain the same, how does the indicated change affect the width of a confidence interval? Explain.

a. Increase in the level of confidence

Textbook Question

Alcohol-Impaired Driving You wish to estimate, with 95% confidence, the population proportion of motor vehicle fatalities that were caused by alcohol-impaired driving. Your estimate must be accurate within 5% of the population proportion.

a. No preliminary estimate is available. Find the minimum sample size needed

Textbook Question

Juice Dispensing Machine A beverage company uses a machine to fill half-gallon bottles with fruit juice (see figure). The company wants to estimate the mean volume of water the machine is putting in the bottles within 0.25 fluid ounce.

[IMAGE]

a. Determine the minimum sample size required to construct a 95% confidence interval for the population mean. Assume the population standard deviation is 1 fluid ounce.

Textbook Question

Cholesterol Contents of Cheese A cheese processing company wants to estimate the mean cholesterol content of all one-ounce servings of a type of cheese. The estimate must be within 0.75 milligram of the population mean.

a. Determine the minimum sample size required to construct a 95% confidence interval for the population mean. Assume the population standard deviation is 3.10 milligrams.

Textbook Question

Ages of College Students An admissions director wants to estimate the mean age of all students enrolled at a college. The estimate must be within 1.5 years of the population mean. Assume the population of ages is normally distributed.

a. Determine the minimum sample size required to construct a 90% confidence interval for the population mean. Assume the population standard deviation is 1.6 years.