


 05:11
05:11

Textbook Question
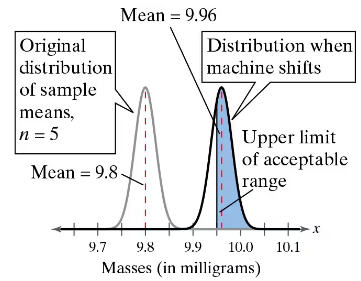
Assume the machine shifts and is filling the vials with a mean amount of 9.96 milligrams and a standard deviation of 0.05 milligram. You select five vials and find the mean amount of compound added.
c. Which is more sensitive to a shift of parameters—an individual random selection or a randomly selected sample mean?