Textbook Question
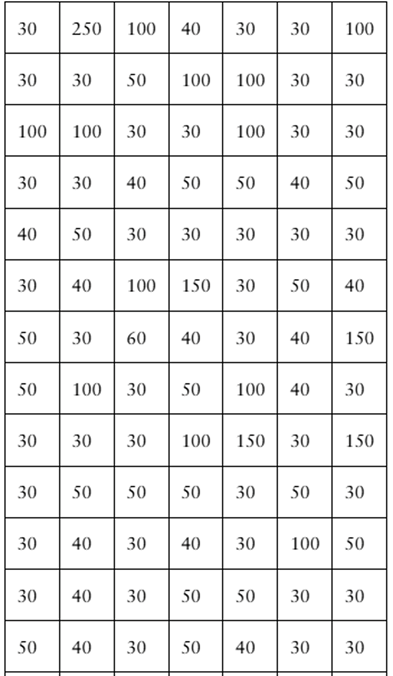
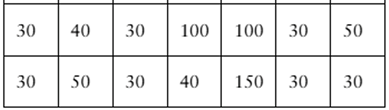
Use frequency distribution formulas to estimate the sample mean and the sample standard deviation of the data set in Exercise 2.

 Verified step by step guidance
 05:11
05:11 05:53
05:53 04:39
04:39Use frequency distribution formulas to estimate the sample mean and the sample standard deviation of the data set in Exercise 2.
The overall averages of 12 students in a statistics class prior to taking the final exam are listed.
67 72 88 73 99 85 81 87 63 94 68 87
d. Display the data in a stem-and-leaf plot. Use one line per stem.
For the four test scores 96, 85, 91, and 86, the first 3 test scores are 20% of the final grade, and the last test score is 40% of the final grade. Find the weighted mean of the test scores.
The overall averages of 12 students in a statistics class prior to taking the final exam are listed.
67 72 88 73 99 85 81 87 63 94 68 87
a. Find the mean, median, and mode of the data set. Which best represents the center of the data?
The data set represents the number of movies that a sample of 20 people watched in a year.
121 148 94 142 170 88 221 106 18 67
149 28 60 101 134 168 92 154 53 66
c. Display the data using a relative frequency histogram.
In Exercises 1 and 2, use the data set, which represents the overall average class sizes for 20 national universities. (Adapted from Public University Honors)
37 34 42 44 39 40 41 51 49 31
52 26 31 40 30 27 36 43 48 35
Construct a relative frequency histogram using the frequency distribution in Exercise 1. Then determine which class has the greatest relative frequency and which has the least relative frequency.