Textbook Question
The overall averages of 12 students in a statistics class prior to taking the final exam are listed.
67 72 88 73 99 85 81 87 63 94 68 87
d. Display the data in a stem-and-leaf plot. Use one line per stem.

 Verified step by step guidance
 04:52
04:52 04:24
04:24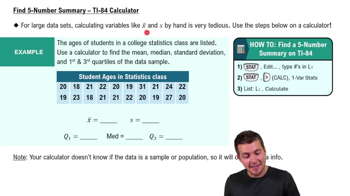 04:51
04:51The overall averages of 12 students in a statistics class prior to taking the final exam are listed.
67 72 88 73 99 85 81 87 63 94 68 87
d. Display the data in a stem-and-leaf plot. Use one line per stem.
In Exercises 5 and 6, use the data set, which represents the number of rooms reserved during one night’s business at a sample of hotels.
153 104 118 166 89 104 100 79 93 96 116
94 140 84 81 96 108 111 87 126 101 111
122 108 126 93 108 87 103 95 129 93 124
Construct a frequency distribution for the data set with six classes and draw a frequency polygon.
In Exercises 37– 40, use the data set, which represents the model 2020 vehicles with the highest fuel economies (in miles per gallon) in the most popular classes. (Source: U.S. Environmental Protection Agency)
36 30 30 45 31 113 113 33 33 33 52 141 56 117 58
118 50 26 23 23 27 48 22 22 22 121 41 105 35 35
About how many vehicles fall on or below the third quartile?
In Exercises 13 and 14, find the mean, the median, and the mode of the data, if possible. If any measure cannot be found or does not represent the center of the data, explain why.
The responses of 1019 adults who were asked how much money they think they will spend on Christmas gifts in a recent year (Adapted from Gallup)
" style="" width="500">
According to data from the city of Toronto, Ontario, Canada, there were nearly 112,000 parking infractions in the city for December 2020, with fines totaling over 5,500,000 Canadian dollars. The fines (in Canadian dollars) for a random sample of 105 parking infractions in Toronto, Ontario, Canada, for December 2020 are listed below. (Source: City of Toronto)
In Exercises 1–5, use technology. If possible, print your results.
Find the sample mean of the data.
In Exercises 1 and 2, use the data set, which represents the overall average class sizes for 20 national universities. (Adapted from Public University Honors)
37 34 42 44 39 40 41 51 49 31
52 26 31 40 30 27 36 43 48 35
Construct a relative frequency histogram using the frequency distribution in Exercise 1. Then determine which class has the greatest relative frequency and which has the least relative frequency.