Ch 32: AC Circuits
Knight Calc - Physics for Scientists and Engineers 5th Edition
Knight Calc5th EditionPhysics for Scientists and EngineersISBN: 9780137344796Not the one you use?Change textbook
Chapter 32, Problem 49b

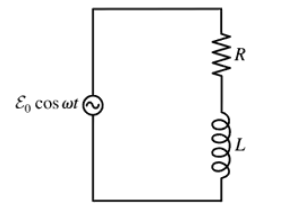
Use a phasor diagram to analyze the RL circuit of FIGURE P32.49. In particular, What is VR in the limits ω→0 and ω→∞?

Verified step by step guidance
1
Step 1: Understand the RL circuit and the role of phasor diagrams. In an RL circuit, the resistor (R) and inductor (L) are connected in series. The phasor diagram represents the voltage and current relationships in the circuit using vectors in the complex plane. The angular frequency ω determines the behavior of the circuit.
Step 2: Analyze the behavior of the circuit as ω → 0. At very low frequencies, the inductive reactance (X_L = ωL) approaches zero because it is proportional to ω. This means the inductor behaves like a short circuit, and the voltage across the resistor (V_R) will equal the total voltage applied to the circuit.
Step 3: Analyze the behavior of the circuit as ω → ∞. At very high frequencies, the inductive reactance (X_L = ωL) becomes very large, effectively acting as an open circuit. In this case, the current in the circuit approaches zero, and the voltage across the resistor (V_R) also approaches zero.
Step 4: Use the phasor diagram to visualize these limits. At ω → 0, the phasor for V_R aligns with the total voltage phasor because the inductor has negligible reactance. At ω → ∞, the phasor for V_R shrinks to zero as the inductor dominates the circuit and blocks current flow.
Step 5: Summarize the results. For ω → 0, V_R equals the total voltage. For ω → ∞, V_R approaches zero. These results are consistent with the behavior of the RL circuit in the frequency domain.

Verified video answer for a similar problem:

This video solution was recommended by our tutors as helpful for the problem above.
Was this helpful?

Key Concepts

Here are the essential concepts you must grasp in order to answer the question correctly.

Phasor Diagrams

Phasor diagrams are graphical representations of sinusoidal functions, where each phasor represents the amplitude and phase of a sinusoidal voltage or current. In the context of AC circuits, phasors simplify the analysis of circuit components by converting differential equations into algebraic equations. This allows for easier calculations of voltages and currents in circuits with resistors, inductors, and capacitors.
Recommended video:

RL Circuit Behavior

An RL circuit consists of a resistor (R) and an inductor (L) connected in series or parallel. The behavior of the circuit changes with frequency; at low frequencies (ω→0), the inductor behaves like a short circuit, while at high frequencies (ω→∞), it acts like an open circuit. Understanding these limits is crucial for determining the voltage across the resistor (VR) in different frequency scenarios.
Recommended video:

Impedance

Impedance is the total opposition a circuit offers to the flow of alternating current (AC) and is represented as a complex number. In an RL circuit, the impedance combines resistance and inductive reactance, which varies with frequency. At ω→0, the impedance is purely resistive, while at ω→∞, the inductive reactance dominates, affecting the voltage across the resistor and the overall circuit behavior.
Recommended video:
Guided course
08:40
Impedance in AC Circuits