Textbook Question
Find f + g, f - g, fg, and f/g. f(x) = x2 + x + 1, g(x) = x2 -1
1
views

 Verified step by step guidance
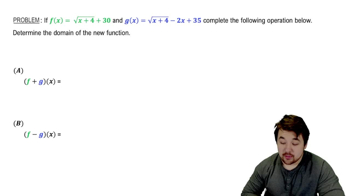
 4:46
4:46 4:26
4:26 02:16
02:16Find f + g, f - g, fg, and f/g. f(x) = x2 + x + 1, g(x) = x2 -1
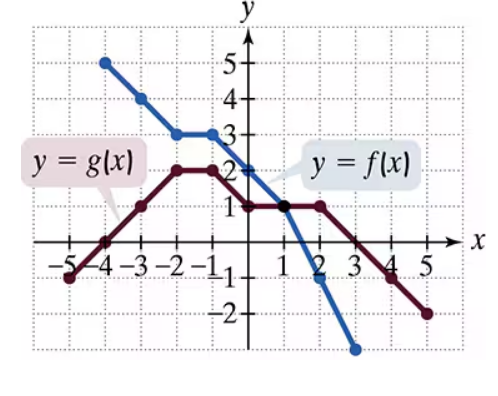
In Exercises 77–92, use the graph to determine a. the function's domain; b. the function's range; c. the x-intercepts, if any; d. the y-intercept, if any; and e. the missing function values, indicated by question marks, below each graph.
In Exercises 82–84, find f + g, f - g, fg, and f/g. Determine the domain for each function. f(x) = 3x - 1, g(x) = x - 5
Begin by graphing the absolute value function, f(x) = |x|. Then use transformations of this graph to graph the given function. g(x) = |x|+3
Begin by graphing the absolute value function, f(x) = |x|. Then use transformations of this graph to graph the given function. g(x) = |x+3|
In Exercises 82–84, find f + g, f - g, fg, and f/g. Determine the domain for each function. f(x) = √(x + 7), g(x) = √(x - 2)