Textbook Question
Begin by graphing the square root function, f(x) = √x. Then use transformations of this graph to graph the given function. h(x) = √(x+1)-1

 Verified step by step guidance
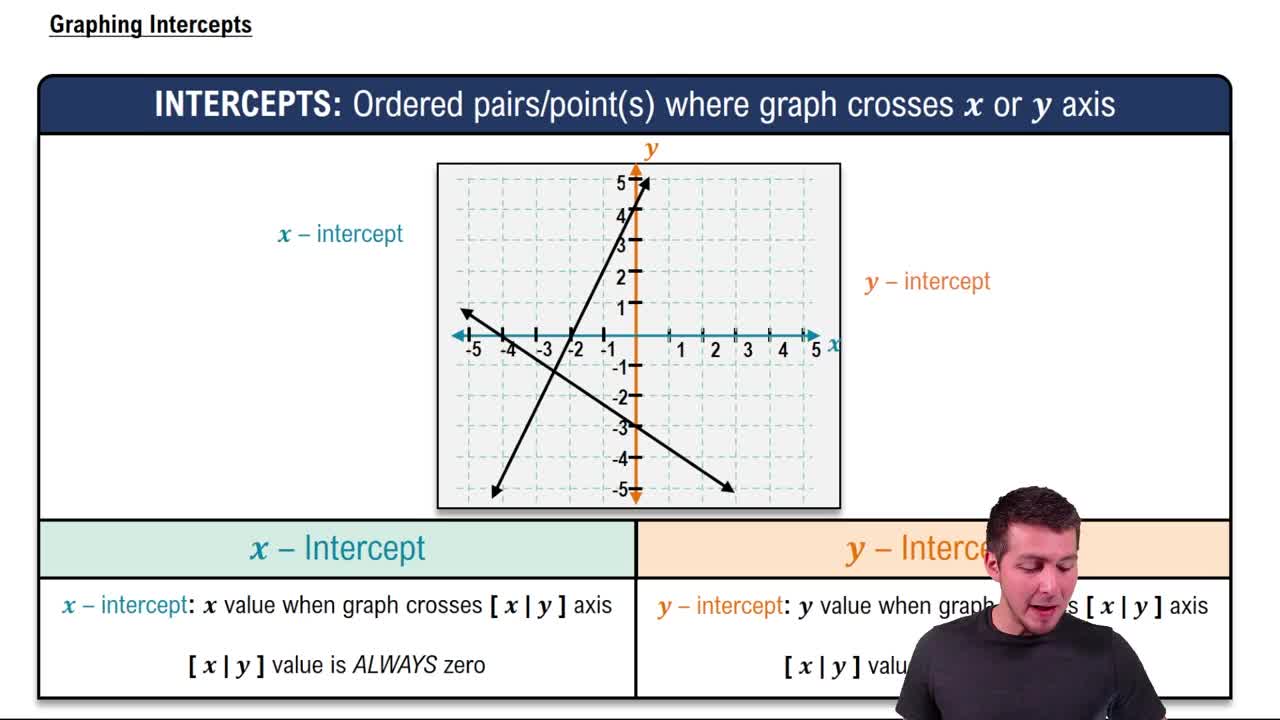
 04:08 04:08
 5:46
5:46Begin by graphing the square root function, f(x) = √x. Then use transformations of this graph to graph the given function. h(x) = √(x+1)-1
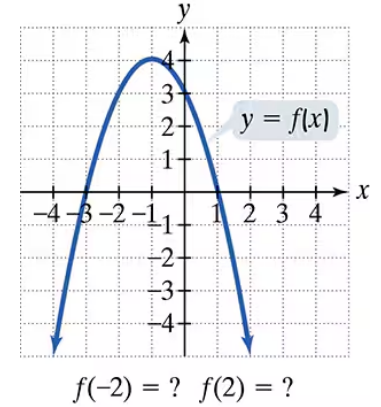
In Exercises 77–92, use the graph to determine a. the function's domain; b. the function's range; and e. the missing function values, indicated by question marks, below each graph.
Give the slope and y-intercept of each line whose equation is given. Assume that B ≠ 0. Ax = By - C
In Exercises 77–92, use the graph to determine a.the x-intercepts, if any; b. the y-intercept, if any; and e. the missing function values, indicated by question marks, below each graph.
Find the domain of each function.
Use the graph to determine a.the x-intercepts, if any; b. the y-intercept, if any; and e. the missing function values, indicated by question marks, below each graph.