Textbook Question
Find the value of y if the line through the two given points is to have the indicated slope. (3, y) and (1, 4), m = −3


 Verified step by step guidance
 3:51
3:51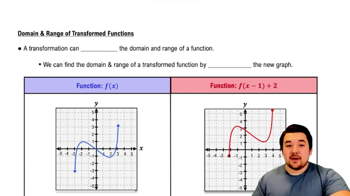 4:22
4:22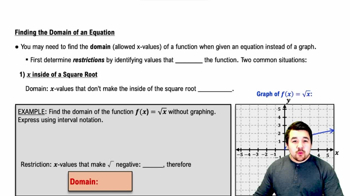 3:43
3:43Find the value of y if the line through the two given points is to have the indicated slope. (3, y) and (1, 4), m = −3
Begin by graphing the square root function, f(x) = √x. Then use transformations of this graph to graph the given function. h(x) = √(x+1)-1
Use the graph to determine a.the x-intercepts, if any; b. the y-intercept, if any; and e. the missing function values, indicated by question marks, below each graph.
In Exercises 77–92, use the graph to determine a.the x-intercepts, if any; b. the y-intercept, if any; and e. the missing function values, indicated by question marks, below each graph.
Find the domain of each function.
Use the graph to determine a.the x-intercepts, if any; b. the y-intercept, if any; and e. the missing function values, indicated by question marks, below each graph.