Tangent lines for a hyperbola Find an equation of the line tangent to the hyperbola x²/a² + y²/b² = 1 at the point (x₀, y₀)
Ch.12 - Parametric and Polar Curves
Briggs3rd EditionCalculus: Early TranscendentalsISBN: 9780136847243Not the one you use?Change textbook
Chapter 12, Problem 12.2.56
53–56. Simple curves Tabulate and plot enough points to sketch a graph of the following equations.
r = 1 - cos θ
Verified step by step guidance1
Recognize that the given equation \(r = 1 - \cos \theta\) is in polar coordinates, where \(r\) is the radius (distance from the origin) and \(\theta\) is the angle measured from the positive x-axis.
Create a table of values by choosing several values of \(\theta\) between \(0\) and \(2\pi\) (for example, \(0\), \(\frac{\pi}{6}\), \(\frac{\pi}{4}\), \(\frac{\pi}{2}\), \(\pi\), \(\frac{3\pi}{2}\), \(2\pi\)). For each \(\theta\), calculate the corresponding \(r\) using the formula \(r = 1 - \cos \theta\).
Convert each polar coordinate \((r, \theta)\) into Cartesian coordinates \((x, y)\) using the formulas \(x = r \cos \theta\) and \(y = r \sin \theta\). This will help in plotting the points on the Cartesian plane.
Plot the points \((x, y)\) on the Cartesian plane. Since \(r\) depends on \(\theta\), the points will trace out the curve as \(\theta\) varies from \(0\) to \(2\pi\).
Connect the plotted points smoothly to sketch the graph of the curve. Notice the shape formed by the curve \(r = 1 - \cos \theta\) is a cardioid, a heart-shaped curve, which is symmetric about the horizontal axis.

Verified video answer for a similar problem:
This video solution was recommended by our tutors as helpful for the problem above.
Video duration:
3mKey Concepts
Here are the essential concepts you must grasp in order to answer the question correctly.
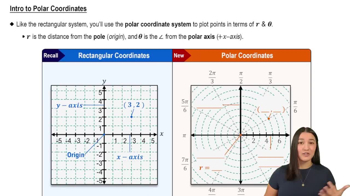
Polar Coordinates
Polar coordinates represent points in the plane using a radius and an angle (r, θ) instead of Cartesian coordinates (x, y). Here, r is the distance from the origin, and θ is the angle from the positive x-axis. Understanding this system is essential for plotting and interpreting curves defined by r as a function of θ.
Recommended video:
Intro to Polar Coordinates
Graphing Polar Equations
Graphing polar equations involves calculating values of r for various θ values, then plotting these points in polar form. By tabulating points for θ in a suitable range (usually 0 to 2π), you can sketch the curve's shape. This process helps visualize the curve defined by r = 1 - cos θ.
Recommended video:
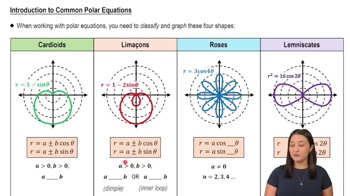
Introduction to Common Polar Equations
Properties of the Cardioid
The equation r = 1 - cos θ describes a cardioid, a heart-shaped curve in polar coordinates. Recognizing this helps anticipate the curve's shape and symmetry. The cardioid has a cusp at the origin and is symmetric about the polar axis, which aids in sketching and understanding its behavior.
Recommended video:
Guided course
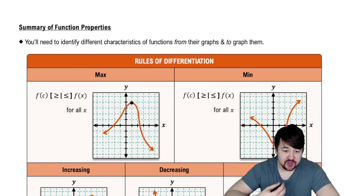
Properties of Functions
Related Practice
Textbook Question
Textbook Question
33–40. Areas of regions Make a sketch of the region and its bounding curves. Find the area of the region.
The region inside the curve r = √(cos θ)
Textbook Question
Given three polar coordinate representations for the origin.
1
views
Textbook Question
33–40. Areas of regions Make a sketch of the region and its bounding curves. Find the area of the region.
The region inside the limaçon r = 2 + cos θ
Textbook Question
15–30. Working with parametric equations Consider the following parametric equations.
a. Eliminate the parameter to obtain an equation in x and y.
b. Describe the curve and indicate the positive orientation.
x = 3 cos t, y = 3 sin t; π ≤ t ≤ 2π
Textbook Question
63–74. Arc length of polar curves Find the length of the following polar curves.
The complete cardioid r = 4 + 4 sin θ