Ch. 3 - Derivatives
Briggs - Calculus: Early Transcendentals 3rd Edition
Briggs3rd EditionCalculus: Early TranscendentalsISBN: 9780136847243Not the one you use?Change textbook
Chapter 3, Problem 3.6.40b

Velocity of a car The graph shows the position s=f(t) of a car t hours after 5:00 P.M. relative to its starting point s=0,where s is measured in miles. <IMAGE>
b. At approximately what time is the car traveling the fastest? The slowest?

Verified step by step guidance
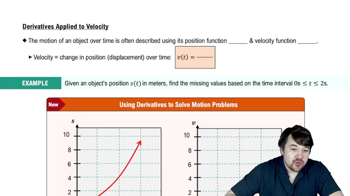
1
To determine when the car is traveling the fastest or the slowest, we need to analyze the graph of the position function s=f(t). The speed of the car is given by the derivative of the position function, which is the velocity v(t)=f'(t).
Identify the points on the graph where the slope of the tangent line is the steepest. The steepest positive slope indicates the fastest speed, while the steepest negative slope indicates the slowest speed.
Look for the points on the graph where the slope changes from positive to negative or vice versa. These points are typically where the velocity is zero, indicating a change in direction or a stop.
Estimate the time t at which these slopes occur by observing the graph. The time when the slope is steepest positive corresponds to the fastest speed, and the time when the slope is steepest negative corresponds to the slowest speed.
Consider the context of the problem: the graph represents the position relative to the starting point at 5:00 P.M. Use this information to convert the time t into actual clock time for your final answer.

Verified video answer for a similar problem:

This video solution was recommended by our tutors as helpful for the problem above.
Video duration:
3m
Was this helpful?

Key Concepts

Here are the essential concepts you must grasp in order to answer the question correctly.

Velocity and Speed

Velocity is the rate of change of position with respect to time, represented mathematically as the derivative of the position function, s=f(t). Speed, a scalar quantity, refers to how fast an object is moving regardless of direction. Understanding how to interpret the graph of position versus time is crucial for determining when the car is traveling fastest or slowest.
Recommended video:
06:29
Derivatives Applied To Velocity

Critical Points

Critical points occur where the derivative of a function is zero or undefined, indicating potential local maxima or minima. In the context of the car's velocity, these points on the graph of the position function can help identify when the car is at its fastest or slowest speeds. Analyzing these points allows us to determine changes in the car's motion.
Recommended video:
04:50
Critical Points

Graph Interpretation

Interpreting graphs involves analyzing the shape and features of the graph to extract meaningful information. For the position-time graph of the car, the slope at any point indicates the car's velocity. A steeper slope corresponds to higher speeds, while a flatter slope indicates slower speeds, which is essential for answering the question about the car's speed at different times.
Recommended video:
06:15
Graphing The Derivative