Textbook Question
Use the graph of g in the figure to do the following. <IMAGE>
b. Find the values of x in (-2,2) at which g is not differentiable.

 Verified step by step guidance
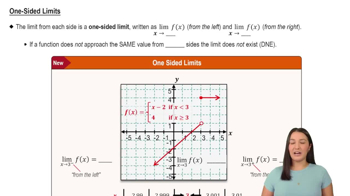
 05:50
05:50 05:02
05:02 05:44
05:44Use the graph of g in the figure to do the following. <IMAGE>
b. Find the values of x in (-2,2) at which g is not differentiable.
Velocity of a car The graph shows the position s=f(t) of a car t hours after 5:00 P.M. relative to its starting point s=0,where s is measured in miles. <IMAGE>
b. At approximately what time is the car traveling the fastest? The slowest?
Use a graphing utility to plot the curve and the tangent line.
y = cos x / 1−cos x; x = π/3
The energy (in joules) released by an earthquake of magnitude M is given by the equation E=25,000 ⋅ 101.5M. (This equation can be solved for M to define the magnitude of a given earthquake; it is a refinement of the original Richter scale created by Charles Richter in 1935.)
Compute dE/dM and evaluate it for M=3. What does this derivative mean? (M has no units, so the units of the derivative are J per change in magnitude.)
{Use of Tech} Computing limits with angles in degrees Suppose your graphing calculator has two functions, one called sin x, which calculates the sine of x when x is in radians, and the other called s(x), which calculates the sine of x when x is in degrees.
b. Evaluate lim x→0 s(x) / x. Verify your answer by estimating the limit on your calculator.
45–50. Tangent lines Carry out the following steps. <IMAGE>
b. Determine an equation of the line tangent to the curve at the given point.
x⁴-x²y+y⁴=1; (−1, 1)