Textbook Question
The graph of ℎ in the figure has vertical asymptotes at x=−2 and x=3. Analyze the following limits. <IMAGE>
lim x→−2^+ h(x)
1
views

 Verified step by step guidance
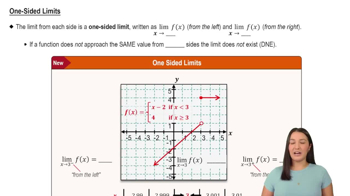
 05:50
05:50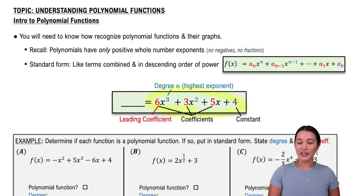 6:04
6:04 3:56
3:56The graph of ℎ in the figure has vertical asymptotes at x=−2 and x=3. Analyze the following limits. <IMAGE>
lim x→−2^+ h(x)
Complete the following steps for the given functions.
b. Find the vertical asymptotes of (if any).
Complete the following steps for the given functions.
b. Find the vertical asymptotes of (if any).
Determine the following limits.
b.
Graph the function f(x)=e^−x / x(x+2)^2 using a graphing utility. (Experiment with your choice of a graphing window.) Use your graph to determine the following limits.
b. lim x→−2 f(x)
Use the graph of in the figure to find the following values or state that they do not exist. <IMAGE>