Ch. 2 - Limits
Briggs - Calculus: Early Transcendentals 3rd Edition
Briggs3rd EditionCalculus: Early TranscendentalsISBN: 9780136847243Not the one you use?Change textbook
Chapter 2, Problem 2.4b

Use the graph of gg in the figure to find the following values or state that they do not exist. <IMAGE>
limx0g(x){\(\displaystyle\]\lim\)_{x\(\to\)0}g\(\left\)(x\(\right\))}

Verified step by step guidance
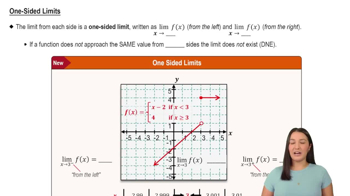
1
Identify the behavior of the function g(x) as x approaches 0 from both the left and the right sides on the graph.
Observe the y-values that g(x) approaches as x gets closer to 0 from the left (x -> 0^-).
Observe the y-values that g(x) approaches as x gets closer to 0 from the right (x -> 0^+).
Determine if the left-hand limit and the right-hand limit are equal. If they are, the limit exists and is equal to this common value.
If the left-hand limit and the right-hand limit are not equal, state that the limit does not exist.

Verified video answer for a similar problem:

This video solution was recommended by our tutors as helpful for the problem above.
Video duration:
2m
Was this helpful?

Key Concepts

Here are the essential concepts you must grasp in order to answer the question correctly.

Limits

A limit is a fundamental concept in calculus that describes the behavior of a function as its input approaches a certain value. It helps in understanding the function's value at points where it may not be explicitly defined. For example, the limit of g(x) as x approaches 0 indicates what value g(x) approaches as x gets closer to 0, which is crucial for analyzing continuity and differentiability.
Recommended video:
05:50
One-Sided Limits

Continuity

Continuity of a function at a point means that the function is defined at that point, the limit exists, and the limit equals the function's value at that point. If g(x) is continuous at x = 0, then the limit as x approaches 0 will equal g(0). Understanding continuity is essential for determining the behavior of functions and their limits.
Recommended video:
05:34
Intro to Continuity

Graph Interpretation

Interpreting the graph of a function is crucial for visualizing its behavior, especially when evaluating limits. The graph provides insights into the function's values, trends, and any discontinuities. By analyzing the graph of g, one can determine the limit as x approaches 0 by observing the y-values that g(x) approaches, which aids in answering the question effectively.
Recommended video:
06:15
Graphing The Derivative