

 3:40
3:40
Textbook Question
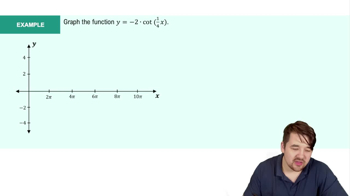
Complete the following steps for the given functions.
c. Graph f and all of its asymptotes with a graphing utility. Then sketch a graph of the function by hand, correcting any errors appearing in the computer-generated graph.
5
views