Ch. 2 - Limits
Briggs - Calculus: Early Transcendentals 3rd Edition
Briggs3rd EditionCalculus: Early TranscendentalsISBN: 9780136847243Not the one you use?Change textbook
Chapter 2, Problem 2.5.55c

Complete the following steps for the given functions. 


c. Graph f and all of its asymptotes with a graphing utility. Then sketch a graph of the function by hand, correcting any errors appearing in the computer-generated graph.


f(x)=4x3+4x2+7x+4x2+1f\(\left\)(x\(\right\))=\(\frac{4x^3+4x^2+7x+4}{x^2+1}\)

Verified step by step guidance
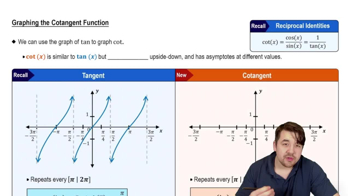
1
Identify the function: \( f(x) = \frac{4x^3 + 4x^2 + 7x + 4}{x^2 + 1} \). This is a rational function where the degree of the numerator is higher than the degree of the denominator.
Determine the vertical asymptotes by setting the denominator equal to zero: \( x^2 + 1 = 0 \). Since this equation has no real solutions, there are no vertical asymptotes.
Find the horizontal or oblique asymptote. Since the degree of the numerator (3) is greater than the degree of the denominator (2), there is no horizontal asymptote. Instead, perform polynomial long division to find the oblique asymptote.
Perform polynomial long division of \( 4x^3 + 4x^2 + 7x + 4 \) by \( x^2 + 1 \) to find the quotient, which represents the oblique asymptote.
Use a graphing utility to plot the function \( f(x) \) and the oblique asymptote. Then, sketch the graph by hand, ensuring to correct any discrepancies observed in the computer-generated graph.

Verified video answer for a similar problem:

This video solution was recommended by our tutors as helpful for the problem above.
Video duration:
3m
Was this helpful?

Key Concepts

Here are the essential concepts you must grasp in order to answer the question correctly.

Asymptotes

Asymptotes are lines that a graph approaches but never touches. They can be vertical, horizontal, or oblique. Vertical asymptotes occur where the function is undefined, typically at values that make the denominator zero. Horizontal asymptotes indicate the behavior of the function as x approaches infinity, showing the end behavior of the graph.
Recommended video:
5:37
Introduction to Cotangent Graph

Graphing Rational Functions

Graphing rational functions involves plotting the function defined as the ratio of two polynomials. Key steps include identifying intercepts, asymptotes, and the behavior of the function at critical points. Understanding the degree of the numerator and denominator helps predict the end behavior and the presence of horizontal asymptotes.
Recommended video:
5:53
Graph of Sine and Cosine Function

Error Correction in Graphing

Error correction in graphing involves comparing a computer-generated graph with a hand-drawn sketch to identify discrepancies. This process requires understanding the function's characteristics, such as asymptotes and intercepts, to ensure accuracy. By analyzing the graph's behavior at critical points, one can refine the sketch to better represent the function.
Recommended video:
04:57
Determining Error and Relative Error