Ch. 5 - Integration
Briggs - Calculus: Early Transcendentals 3rd Edition
Briggs3rd EditionCalculus: Early TranscendentalsISBN: 9780136847243Not the one you use?Change textbook
Chapter 5, Problem 5.1.71b

Displacement from a velocity graph Consider the velocity function for an object moving along a line (see figure).
(b) Use geometry to find the displacement of the object between t = 0 and t = 2.
Graph showing velocity in meters per second over time in seconds, with a flat line indicating constant velocity segments.

Verified step by step guidance
1
Step 1: Understand the problem. The displacement of an object can be found by calculating the area under the velocity-time graph between t = 0 and t = 2 seconds. This is because displacement is the integral of velocity over time.
Step 2: Analyze the graph. Between t = 0 and t = 2 seconds, the velocity graph forms two geometric shapes: a triangle from t = 0 to t = 1 and a rectangle from t = 1 to t = 2.
Step 3: Calculate the area of the triangle. The triangle has a base of 1 second (from t = 0 to t = 1) and a height of 20 m/s (velocity at t = 1). Use the formula for the area of a triangle: A = (1/2) × base × height.
Step 4: Calculate the area of the rectangle. The rectangle spans from t = 1 to t = 2 seconds, with a width of 1 second and a constant height of 20 m/s. Use the formula for the area of a rectangle: A = width × height.
Step 5: Add the areas of the triangle and rectangle. The total displacement is the sum of these areas, which represents the total area under the velocity graph from t = 0 to t = 2 seconds.

Verified video answer for a similar problem:

This video solution was recommended by our tutors as helpful for the problem above.
Video duration:
2m
Was this helpful?

Key Concepts

Here are the essential concepts you must grasp in order to answer the question correctly.

Velocity and Displacement

Velocity is the rate of change of displacement with respect to time, indicating how fast an object is moving in a specific direction. Displacement, on the other hand, is the overall change in position of the object, which can be calculated by integrating the velocity function over a given time interval. In this context, understanding the relationship between velocity and displacement is crucial for solving the problem.
Recommended video:
10:17
Using The Velocity Function

Area Under the Curve

In a velocity-time graph, the displacement of an object can be determined by calculating the area under the velocity curve between two time points. Each segment of the graph represents a different velocity, and the area can be computed using geometric shapes such as rectangles and triangles. This geometric approach simplifies the process of finding displacement without needing to perform calculus directly.
Recommended video:
05:59
Estimating the Area Under a Curve with Right Endpoints & Midpoint

Geometric Shapes in Graphs

When analyzing a velocity graph, different segments can form various geometric shapes, such as rectangles and triangles. The area of these shapes corresponds to the displacement during specific time intervals. For example, a rectangle's area is calculated as base times height, while a triangle's area is one-half base times height, allowing for straightforward calculations of displacement based on the graph's features.
Recommended video:
06:15
Graphing The Derivative
Related Practice
Textbook Question

Explain why or why not Determine whether the following statements are true and give an explanation or counterexample.

(a) If ƒ is symmetric about the line 𝓍 = 2 , then ∫₀⁴ ƒ(𝓍) d𝓍 = 2 ∫₀² ƒ(𝓍) d𝓍.

1
views
Textbook Question

Use Table 5.6 to evaluate the following indefinite integrals.                                                                                                               


 (b) ∫ sec 5𝓍 tan 5𝓍 d𝓍

Textbook Question

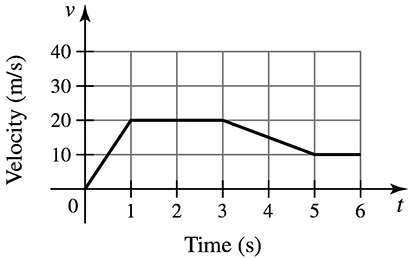
Free fall On October 14, 2012, Felix Baumgartner stepped off a balloon capsule at an altitude of almost 39 km above Earth’s surface and began his free fall. His velocity in m/s during the fall is given in the figure. It is claimed that Felix reached the speed of sound 34 seconds into his fall and that he continued to fall at supersonic speed for 30 seconds. (Source: http://www.redbullstratos.com)

(a) Divide the interval [34, 64] into n = 5 subintervals with the gridpoints x₀ = 34 , x₁ = 40 , x₂ = 46 , x₃ = 52 , x₄ = 58 , and x₅ = 64. Use left and right Riemann sums to estimate how far Felix fell while traveling at supersonic speed.

Textbook Question

Area functions The graph of ƒ is shown in the figure. Let A(x) = ∫₀ˣ ƒ(t) dt and F(x) = ∫₂ˣ ƒ(t) dt be two area functions for ƒ. Evaluate the following area functions.

(a) A(2)

1
views
Textbook Question

Matching functions with area functions Match the functions ƒ, whose graphs are given in a― d, with the area functions A (𝓍) = ∫₀ˣ ƒ(t) dt, whose graphs are given in A–D.


1
views
Textbook Question

Explain why or why not Determine whether the following statements are true and give an explanation or counterexample.                                                                          

                                                                                                                                                                                     (b) Suppose ƒ is a negative increasing function, for 𝓍 > 0 . Then the area function A(𝓍) = ∫₀ˣ ƒ(t) dt is a decreasing function of 𝓍 .