Textbook Question
In Exercises 29–51, find the exact value of each expression. Do not use a calculator. sec⁻¹ (−1)
1
views

 Verified step by step guidance
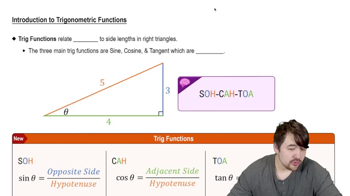
 6:04
6:04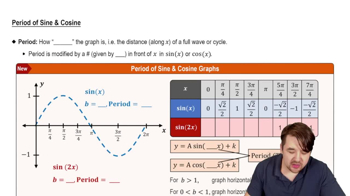 5:33 5:33
In Exercises 29–51, find the exact value of each expression. Do not use a calculator. sec⁻¹ (−1)
In Exercises 37–40, an object moves in simple harmonic motion described by the given equation, where t is measured in seconds and d in inches. In each exercise, graph one period of the equation. Then find the following: a. the maximum displacement b. the frequency c. the time required for one cycle d. the phase shift of the motion. d = 3 cos(πt + π/2)
In Exercises 35–42, determine the amplitude and period of each function. Then graph one period of the function. y = cos 2x
Graph two periods of the given cosecant or secant function.
y = sec x/2
In Exercises 29–44, graph two periods of the given cosecant or secant function. y = −2 csc πx
In Exercises 27–38, use a calculator to find the value of each expression rounded to two decimal places. ___ tan⁻¹ (−√473)