Textbook Question
5. Which event(s) in Exercise 4 can be considered unusual? Explain your reasoning.

 Verified step by step guidance
 5:37
5:37 06:21
06:21 06:38
06:385. Which event(s) in Exercise 4 can be considered unusual? Explain your reasoning.
Your dorm enters 15 out of 65 plastic numbered ducks in a duck race. The ducks are all dumped into a stream and drift to the finish line. What is the probability that three of your dorm's ducks finish first, second, and third?
5. Use technology to randomly select two numbers from 1 to 6. Find the sum and subtract 1 to obtain a total.
a. What is the theoretical probability of each total from 1 to 11?
b. Use this procedure to select 100 totals from 1 to 11. Tally your results and compare them with the probabilities in part (a).
7. There are 16 students giving final presentations in your history course.
b. Presentation subjects are based on the units of the course. Unit B is covered by three students, Unit C is covered by five students, and Units A and D are each covered by four students. How many presentation orders are possible when presentations on
the same unit are indistinguishable from each other?
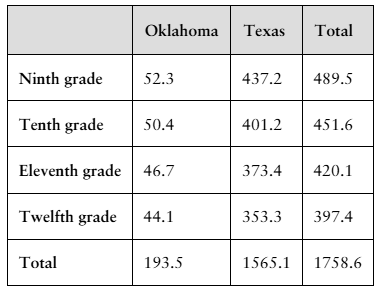
4. The table on the left shows the secondary school student enrollment levels (in thousands by grade) in Oklahoma and Texas schools in a recent year. (Source: U.S. Nation
for Education Statistics)
A student in one of the indicated grades and states is randomly selected. Find the probability of selecting a student who
d. is enrolled in Texas, given that the student is in twelfth grade.
2. How many possible variations are there in Mozart's Musical Dice Game minuet? Explain.