Ch. 2 - Descriptive Statistics
Larson - Elementary Statistics: Picturing the World 8th Edition
Larson8th EditionElementary Statistics: Picturing the WorldISBN: 9780137493470Not the one you use?Change textbook
Chapter 2, Problem 2.3.58a

U.S. Trade Deficits The table at the left shows the U.S. trade deficits (in billions of dollars) with 18 countries in 2020. (Source: U.S. Department of Commerce)


<IMAGE>


a. Find the mean and the median of the trade deficits.

Verified step by step guidance
1
Step 1: To find the mean of the trade deficits, sum up all the trade deficit values provided in the table. The trade deficits are: 310.8, 112.7, 69.7, 57.3, 56.7, 55.9, 55.4, 31.7, 29.9, 29.5, 26.4, 24.8, 23.8, 15.6, 15.2, 12.8, 12.0, and 8.6. Add these values together.
Step 2: Divide the total sum obtained in Step 1 by the number of countries listed in the table. There are 18 countries, so divide the total sum by 18 to calculate the mean.
Step 3: To find the median, first arrange the trade deficit values in ascending order. The ordered values are: 8.6, 12.0, 12.8, 15.2, 15.6, 23.8, 24.8, 26.4, 29.5, 29.9, 31.7, 55.4, 55.9, 56.7, 57.3, 69.7, 112.7, 310.8.
Step 4: Since there are 18 values (an even number), the median is the average of the two middle values. Identify the two middle values in the ordered list (the 9th and 10th values) and calculate their average.
Step 5: Report the mean and median values calculated in Steps 2 and 4 as the final results.

Verified video answer for a similar problem:

This video solution was recommended by our tutors as helpful for the problem above.
Video duration:
5m
Was this helpful?

Key Concepts

Here are the essential concepts you must grasp in order to answer the question correctly.

Mean

The mean, or average, is calculated by summing all the values in a dataset and then dividing by the number of values. In the context of trade deficits, it provides a central value that represents the overall trade deficit across the countries listed. This measure is sensitive to extreme values, which can skew the mean if there are significant outliers.
Recommended video:
Guided course
04:52
Calculating the Mean

Median

The median is the middle value in a dataset when the values are arranged in ascending or descending order. It is a robust measure of central tendency that is less affected by outliers compared to the mean. For trade deficits, the median gives a better sense of the typical deficit experienced with the countries listed, especially if there are countries with very high or low deficits.
Recommended video:
Guided course
03:26
Calculating the Median

Trade Deficit

A trade deficit occurs when a country's imports exceed its exports, resulting in a negative balance of trade. In the context of the U.S. trade deficits with various countries, it indicates how much more the U.S. is spending on foreign goods and services compared to what it is earning from exports. Understanding trade deficits is crucial for analyzing economic health and international trade relationships.
Related Practice
Textbook Question

Extending Concepts


Trimmed Mean To find the 10% trimmed mean of a data set, order the data, delete the lowest 10% of the entries and the highest 10% of the entries, and find the mean of the remaining entries.


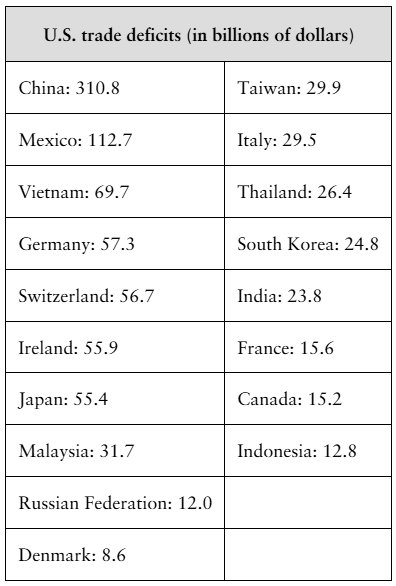
a. Find the 10% trimmed mean for the data in Exercise 65.

Textbook Question

Using and Interpreting Concepts


Using and Interpreting Concepts Finding Quartiles, Interquartile Range, and Outliers In Exercises 11 and 12,

(a) find the quartiles


56 63 51 60 57 60 60 54 63 59 80 63 60 62 65

Textbook Question

use the ogive to approximate

the number in the sample.

1
views
Textbook Question

Song Lengths Side-by-side box-and-whisker plots can be used to compare two or more different data sets. Each box-and-whisker plot is drawn on the same number line to compare the data sets more easily. The lengths (in seconds) of songs played at two different concerts are shown.

a. Describe the shape of each distribution. Which concert has less variation in song lengths?

Textbook Question

Drawing a Box-and-Whisker Plot In Exercises 15–18,

(a) find the five-number summary


2 7 1 3 1 2 8 9 9 2 5 4 7 3 7 5 4

2 3 5 9 5 6 3 9 3 4 9 8 8 2 3 9 5

1
views
Textbook Question

What Would You Do? You work at a bank and are asked to recommend the amount of cash to put in an ATM each day. You do not want to put in too much (which would cause security concerns) or too little (which may create customer irritation). The daily withdrawals (in hundreds of dollars) for 30 days are listed. 72 84 61 76 104 76 86 92 80 88 98 76 97 82 84 67 70 81 82 89 74 73 86 81 85 78 82 80 91 83

Construct a relative frequency histogram for the data. Use 8 classes.

1
views