Skip to main content
Statistics
My Course
Learn
Exam Prep
AI Tutor
Study Guides
Textbook Solutions
Flashcards
Explore
Try the app
My Course
Learn
Exam Prep
AI Tutor
Study Guides
Textbook Solutions
Flashcards
Explore
Try the app
Back
Two-Way ANOVA - Excel quiz
You can tap to flip the card.
What is the main purpose of a two-way ANOVA test?
You can tap to flip the card.
👆
What is the main purpose of a two-way ANOVA test?
A two-way ANOVA analyzes differences in means across two factors and tests for interaction effects between them.
Track progress
Control buttons has been changed to "navigation" mode.
1/15
Related flashcards
Related practice
Recommended videos
Two-Way ANOVA - Excel definitions
Two-Way ANOVA - Excel
15 Terms
Two-Way ANOVA
14. ANOVA
5 problems
Topic
Justin
14. ANOVA - Part 1 of 2
4 topics
12 problems
Chapter
Ally
14. ANOVA - Part 2 of 2
1 topic
3 problems
Chapter
Justin
Guided course
08:34
Two-Way ANOVA Using Excel
3
views
Guided course
09:46
Two-Way ANOVA Using Excel Example 1
2
views
Terms in this set (15)
Hide definitions
What is the main purpose of a two-way ANOVA test?
A two-way ANOVA analyzes differences in means across two factors and tests for interaction effects between them.
What is the first step when conducting a two-way ANOVA?
The first step is to test for an interaction effect between the two factors.
What does a significant interaction effect in two-way ANOVA indicate?
It indicates that the two factors influence each other, making it difficult to determine which factor is responsible for differences in means.
What should you do if you find a significant interaction effect in two-way ANOVA?
You should stop further testing because the results for individual factors are unreliable due to the interaction.
What is the null hypothesis for the interaction effect in two-way ANOVA?
The null hypothesis assumes there is no interaction effect between the two factors.
How do you interpret a p-value greater than alpha (0.05) for the interaction effect?
You fail to reject the null hypothesis, indicating no evidence of an interaction effect.
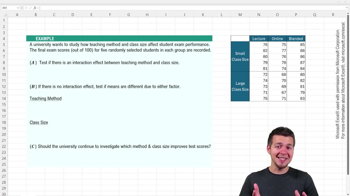
What are the two factors in the example problem discussed in the lesson?
The two factors are advertising medium (social media, TV, email) and discount level (none, 20%).
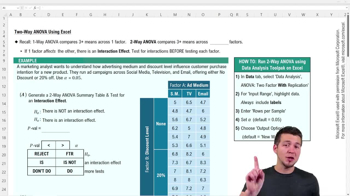
Which Excel tool is used for two-way ANOVA analysis?
The Data Analysis Toolpak's 'ANOVA: Two-Factor with Replication' is used.
What information must you provide Excel for two-way ANOVA with replication?
You must select the input range including labels and specify the number of rows per sample for factor B.
Where do you find the interaction effect results in the Excel ANOVA output table?
The interaction effect results are found in the row labeled 'Interaction,' showing the F statistic and p-value.
What is the next step if there is no interaction effect in two-way ANOVA?
You test for differences in means due to each factor separately, similar to one-way ANOVA tests.
How do you interpret a low p-value for a factor in two-way ANOVA?
A low p-value means you reject the null hypothesis and conclude there is a difference in means due to that factor.
What does the 'Columns' row in the Excel ANOVA output represent?
The 'Columns' row represents the advertising medium factor in the analysis.
What does the 'Sample' row in the Excel ANOVA output represent?
The 'Sample' row represents the discount level factor in the analysis.
Can both factors in a two-way ANOVA show significant differences in means independently?
Yes, both factors can independently show significant differences in means if their p-values are less than alpha.
 BackBack
 08:34
08:34