
 7:27
7:27
Textbook Question
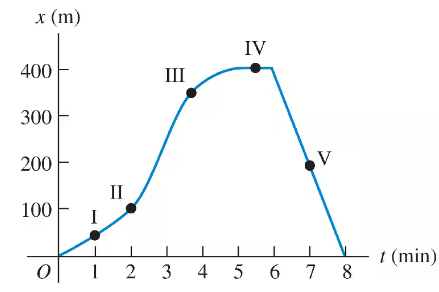
A physics professor leaves her house and walks along the sidewalk toward campus. After min, it starts to rain, and she returns home. Her distance from her house as a function of time is shown in Fig. E. At which of the labeled points is her velocity zero?
2
views