Ch. 02 - Describing Motion: Kinematics in One Dimension
Giancoli Douglas - Physics for Scientists and Engineers 5th edition
Giancoli Douglas5th editionPhysics for Scientists and EngineersISBN: 9780137488179Not the one you use?Change textbook
Chapter 2, Problem 30c

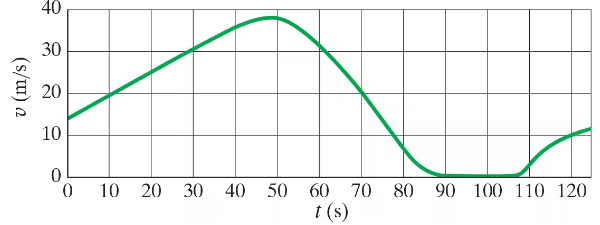
Figure 2–42 shows the velocity of a train as a function of time. During what periods, if any, was the acceleration constant?
0c

Verified step by step guidance
1
Examine the velocity vs. time graph provided in the problem. Recall that acceleration is the rate of change of velocity with respect to time, mathematically expressed as \( a = \frac{\Delta v}{\Delta t} \). Constant acceleration implies that the graph should show a straight line (linear relationship) in the velocity vs. time plot.
Identify the segments of the graph where the slope (\( \frac{\Delta v}{\Delta t} \)) is constant. A constant slope indicates that the acceleration is uniform during that time interval.
For each segment of the graph, calculate the slope by selecting two points on the line and using the formula \( \text{slope} = \frac{v_2 - v_1}{t_2 - t_1} \). If the slope remains the same across the segment, the acceleration is constant.
Mark the time intervals corresponding to the segments with constant slope. These intervals represent the periods during which the acceleration was constant.
Summarize the identified time intervals and ensure they align with the graph's visual representation. Clearly state the periods of constant acceleration based on the analysis of the graph.

Verified video answer for a similar problem:

This video solution was recommended by our tutors as helpful for the problem above.
Was this helpful?

Key Concepts

Here are the essential concepts you must grasp in order to answer the question correctly.

Acceleration

Acceleration is defined as the rate of change of velocity with respect to time. It can be constant or variable, depending on whether the velocity changes uniformly or not. In a velocity vs. time graph, constant acceleration is indicated by a straight line, while a curved line suggests changing acceleration.
Recommended video:
Guided course
05:47
Intro to Acceleration

Velocity-Time Graphs

A velocity-time graph visually represents an object's velocity over time. The slope of the graph indicates acceleration; a positive slope means acceleration, while a negative slope indicates deceleration. Flat sections of the graph indicate constant velocity, and the shape of the graph helps identify periods of constant acceleration.
Recommended video:
Guided course
05:59
Velocity-Time Graphs & Acceleration

Intervals of Constant Acceleration

Intervals of constant acceleration occur when the velocity changes at a uniform rate over time. In a velocity-time graph, these intervals are represented by straight line segments. Identifying these intervals involves looking for sections where the slope remains unchanged, indicating that the acceleration is consistent throughout that period.
Recommended video:
Guided course
08:59
Phase Constant of a Wave Function