Ch. 02 - Describing Motion: Kinematics in One Dimension
Giancoli Douglas - Physics for Scientists and Engineers 5th edition
Giancoli Douglas5th editionPhysics for Scientists and EngineersISBN: 9780137488179Not the one you use?Change textbook
Chapter 2, Problem 30b

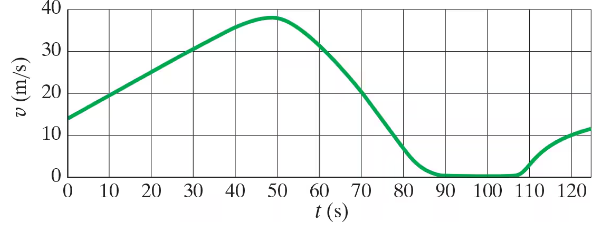
Figure 2–42 shows the velocity of a train as a function of time. During what periods, if any, was the velocity constant?
Graph showing a train's velocity over time, indicating periods of constant velocity and changes in acceleration.

Verified step by step guidance
1
Examine the velocity vs. time graph provided in the problem. A constant velocity corresponds to a horizontal line on the graph, where the slope of the line is zero.
Identify the time intervals on the graph where the slope of the velocity curve is zero. These intervals represent periods during which the velocity does not change with time.
Note that during these intervals, the train is neither accelerating nor decelerating, as the acceleration (rate of change of velocity) is zero.
Mark the specific time periods (e.g., t1 to t2) on the graph where the velocity remains constant. These are the flat, horizontal segments of the graph.
Summarize the identified time intervals as the periods during which the velocity of the train was constant, based on the graph's visual representation.

Verified video answer for a similar problem:

This video solution was recommended by our tutors as helpful for the problem above.
Was this helpful?

Key Concepts

Here are the essential concepts you must grasp in order to answer the question correctly.

Velocity

Velocity is a vector quantity that refers to the rate at which an object changes its position. It is defined as the displacement of the object divided by the time taken for that displacement. In the context of the question, understanding velocity is crucial to determine when it remains constant, which is indicated by a horizontal line on a velocity vs. time graph.
Recommended video:
Guided course
7:27
Escape Velocity

Constant Velocity

Constant velocity occurs when an object moves at a uniform speed in a straight line, meaning there is no change in speed or direction over time. On a velocity vs. time graph, this is represented by a flat, horizontal line. Identifying periods of constant velocity in the graph is essential for answering the question accurately.
Recommended video:
Guided course
08:59
Phase Constant of a Wave Function

Graph Interpretation

Graph interpretation involves analyzing graphical data to extract meaningful information. In this case, it requires understanding how to read a velocity vs. time graph to identify sections where the velocity remains unchanged. This skill is vital for determining the specific time intervals during which the train's velocity is constant.
Recommended video:
Guided course
07:32
Graphing Position, Velocity, and Acceleration Graphs