Ch. 1 - Equations and Inequalities
Lial - College Algebra 13th Edition
Lial13th EditionCollege AlgebraISBN: 9780136881063Not the one you use?Change textbook
Chapter 2, Problem 7

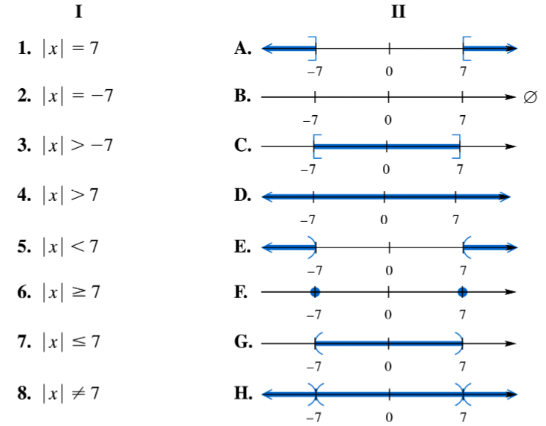
Match each equation or inequality in Column I with the graph of its solution set in Column II. | x | ≤ 7
List of absolute value equations and inequalities matched with number line graphs showing solution sets between -7 and 7.

Verified step by step guidance
1
Understand the inequality \(|x| \leq 7\). The absolute value \(|x|\) represents the distance of \(x\) from 0 on the number line, so this inequality means the distance from 0 is less than or equal to 7.
Rewrite the inequality without the absolute value by considering the definition: \(|x| \leq 7\) is equivalent to \(-7 \leq x \leq 7\).
Interpret the solution set \(-7 \leq x \leq 7\) as all real numbers \(x\) between -7 and 7, including the endpoints -7 and 7.
Look for the graph in Column II that shows a line segment or interval on the number line starting at -7 and ending at 7, with solid dots or closed circles at both ends to indicate inclusion of the endpoints.
Confirm that the graph matches the interval \([-7, 7]\) and that no other graphs represent this solution set.

Verified video answer for a similar problem:

This video solution was recommended by our tutors as helpful for the problem above.
Video duration:
3m
Was this helpful?

Key Concepts

Here are the essential concepts you must grasp in order to answer the question correctly.

Absolute Value Inequality

An absolute value inequality like |x| ≤ 7 represents all values of x whose distance from zero on the number line is less than or equal to 7. This means x lies between -7 and 7, inclusive. Understanding this helps in identifying the solution set as an interval.
Recommended video:
06:07
Linear Inequalities

Interval Notation and Graphing

Interval notation expresses the set of solutions compactly, such as [-7, 7] for |x| ≤ 7. Graphing this interval on a number line involves shading all points between -7 and 7, including the endpoints, to visually represent the solution set.
Recommended video:
05:18
Interval Notation

Matching Equations to Graphs

Matching equations or inequalities to their graphs requires recognizing the solution set's shape and boundaries. For |x| ≤ 7, the graph is a line segment from -7 to 7. This skill involves interpreting algebraic expressions and linking them to their visual representations.
Recommended video:
Guided course
04:29
Graphing Equations of Two Variables by Plotting Points