Solve each problem. Suppose two acid solutions are mixed. One is 26% acid and the other is 34% acid. Which one of the following concentrations cannot possibly be the concentration of the mixture? A. 24% B. 30% C. 31% D. 33%
Ch. 1 - Equations and Inequalities

Chapter 2, Problem 8
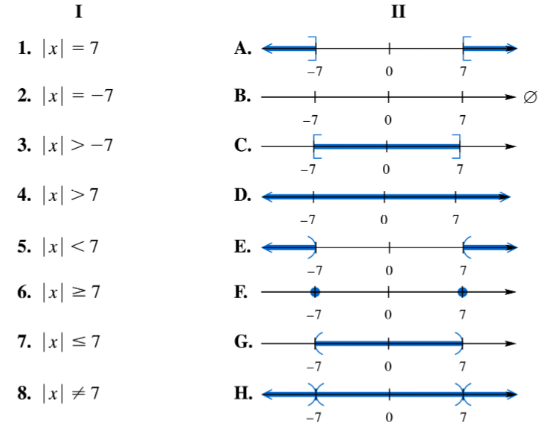
Match each equation or inequality in Column I with the graph of its solution set in Column II. | x | ≠ 7

Verified step by step guidance1
Understand the inequality \( |x| \neq 7 \) means the absolute value of \( x \) is not equal to 7. This excludes the points where \( x = 7 \) and \( x = -7 \).
Recall that \( |x| = 7 \) corresponds to the two points \( x = 7 \) and \( x = -7 \) on the number line.
Since the inequality is \( |x| \neq 7 \), the solution set includes all real numbers except \( x = 7 \) and \( x = -7 \).
On the graph, this will be represented by the entire number line with open circles (or holes) at \( x = 7 \) and \( x = -7 \), indicating these points are not included.
Match this description to the graph in Column II that shows all points except \( x = 7 \) and \( x = -7 \) excluded.

Verified video answer for a similar problem:
This video solution was recommended by our tutors as helpful for the problem above.
Video duration:
2mKey Concepts
Here are the essential concepts you must grasp in order to answer the question correctly.
Absolute Value
The absolute value of a number represents its distance from zero on the number line, always as a non-negative value. For example, |x| = 7 means x is either 7 or -7, since both are 7 units from zero.
Recommended video:
Parabolas as Conic Sections Example 1
Inequalities Involving Absolute Value
An inequality like |x| ≠ 7 means x cannot be exactly 7 or -7, but can be any other real number. Understanding how to interpret and graph such inequalities is essential for matching them to their solution sets.
Recommended video:
Linear Inequalities
Graphing Solution Sets on the Number Line
Graphing solution sets involves representing all values that satisfy an equation or inequality on a number line. For |x| ≠ 7, the graph excludes points at 7 and -7, showing all other points shaded or included.
Recommended video:
Graphing Lines in Slope-Intercept Form
Related Practice
Textbook Question
3
views
Textbook Question
Match each equation or inequality in Column I with the graph of its solution set in Column II. | x | ≤ 7
1
views
Textbook Question
Decide whether each statement is true or false. The equation 5x=4x is an example of a contradiction.
2
views
Textbook Question
Use Choices A–D to answer each question. A. 3x2 - 17x - 6 = 0 B. (2x + 5)2 = 7 C. x2 + x = 12 D. (3x - 1)(x - 7) = 0 Which equation is set up for direct use of the zero-factor property? Solve it.
Textbook Question
Decide whether each statement is true or false. If false, correct the right side of the equation. i12 = 1
Textbook Question
Match each equation in Column I with the correct first step for solving it in Column II. √(x+5) = 7
1
views