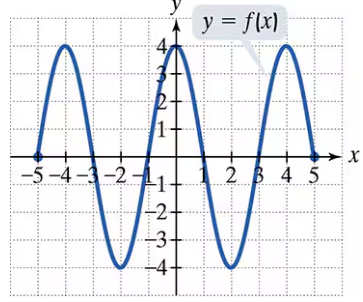
Textbook Question
In Exercises 64–66, begin by graphing the square root function, f(x) = √x. Then use transformations of this graph to graph the given function. r(x) = 2√(x + 2)

 Verified step by step guidance
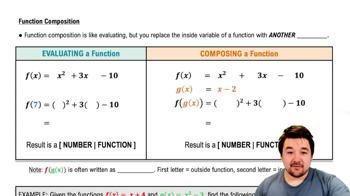
 4:56
4:56 05:10 05:10
In Exercises 64–66, begin by graphing the square root function, f(x) = √x. Then use transformations of this graph to graph the given function. r(x) = 2√(x + 2)
Complete the square and write the equation in standard form. Then give the center and radius of each circle and graph the equation. x² + y²+3x+5y+9/4=0
Find a. (fog) (x) b. (go f) (x) c. (fog) (2) d. (go f) (2).
f(x) = 1/x, g(x)= 1/x
Begin by graphing the standard quadratic function, f(x) = x². Then use transformations of this graph to graph the given function. h(x) = (1/2) (x − 1)² – 1
A line segment through the center of each circle intersects the circle at the points shown. a. Find the coordinates of the circle's center. b. Find the radius of the circle. c. Use your answers from parts (a) and (b) to write the standard form of the circle's equation.
In Exercises 64–66, begin by graphing the square root function, f(x) = √x. Then use transformations of this graph to graph the given function. g(x) = √(x + 3)