Complete the square and write the equation in standard form. Then give the center and radius of each circle and graph the equation. x² + y² - 6y -7=0
Ch. 2 - Functions and Graphs

Chapter 3, Problem 60
In Exercises 59-66, a. Rewrite the given equation in slope-intercept form. b. Give the slope and y-intercept. c. Use the slope and y-intercept to graph the linear function. 4x+y-6=0
Verified step by step guidance
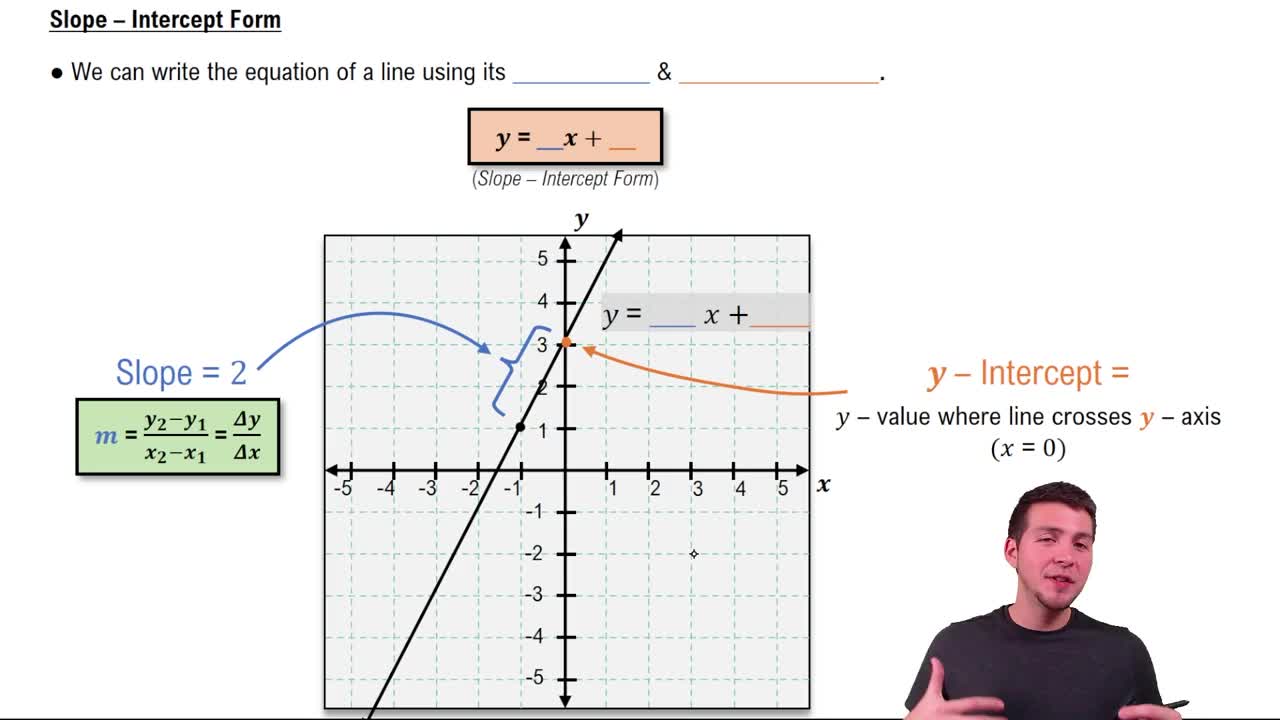
1
Start with the given equation: \(4x + y - 6 = 0\).
Rewrite the equation to solve for \(y\) in terms of \(x\) to get it into slope-intercept form \(y = mx + b\). To do this, isolate \(y\) by subtracting \$4x\( and adding \(6\) to both sides: \)y = -4x + 6$.
Identify the slope \(m\) and the y-intercept \(b\) from the slope-intercept form \(y = mx + b\). Here, the slope \(m\) is the coefficient of \(x\), which is \(-4\), and the y-intercept \(b\) is the constant term, which is \(6\).
To graph the linear function, start by plotting the y-intercept point \((0, 6)\) on the coordinate plane.
Use the slope \(m = -4\) to find another point. Since slope is rise over run, from the y-intercept move down 4 units (rise = -4) and right 1 unit (run = 1) to plot a second point. Then draw a straight line through these two points to complete the graph.

Verified video answer for a similar problem:
This video solution was recommended by our tutors as helpful for the problem above.
Video duration:
5mWas this helpful?
Key Concepts
Here are the essential concepts you must grasp in order to answer the question correctly.
Slope-Intercept Form
The slope-intercept form of a linear equation is y = mx + b, where m represents the slope and b represents the y-intercept. Rewriting an equation into this form makes it easier to identify these values and to graph the line.
Recommended video:
Guided course
Slope-Intercept Form
Slope of a Line
The slope (m) measures the steepness and direction of a line, calculated as the ratio of the change in y to the change in x (rise over run). It indicates how much y changes for a unit change in x and is essential for understanding the line's behavior.
Recommended video:
Guided course
The Slope of a Line
Graphing Using Slope and Y-Intercept
Graphing a linear function involves plotting the y-intercept (where the line crosses the y-axis) and then using the slope to find other points by moving vertically and horizontally. This method provides a straightforward way to visualize the line on the coordinate plane.
Recommended video:
Guided course
Graphing Lines in Slope-Intercept Form
Related Practice
Textbook Question
2
views
Textbook Question
In Exercises 55–64, use the vertical line test to identify graphs in which y is a function of x.
1
views
Textbook Question
Let f(x) = 2x - 5 g(x) = 4x - 1 h(x) = x² + x + 2. Evaluate the indicated function without finding an equation for the function. ƒ-1 (1)
Textbook Question
In Exercises 60–63, begin by graphing the standard quadratic function, f(x) = x^2. Then use transformations of this graph to graph the given function. g(x) = x^2 + 2
Textbook Question
Use the vertical line test to identify graphs in which y is a function of x.
Textbook Question
Complete the square and write the equation in standard form. Then give the center and radius of each circle and graph the equation. x² + y² − x + 2y + 1 = 0
1
views
