Ch. 2 - Functions and Graphs
Blitzer - College Algebra 8th Edition
Blitzer8th EditionCollege AlgebraISBN: 9780136970514Not the one you use?Change textbook
Chapter 3, Problem 60

In Exercises 55–64, use the vertical line test to identify graphs in which y is a function of x.

Verified step by step guidance
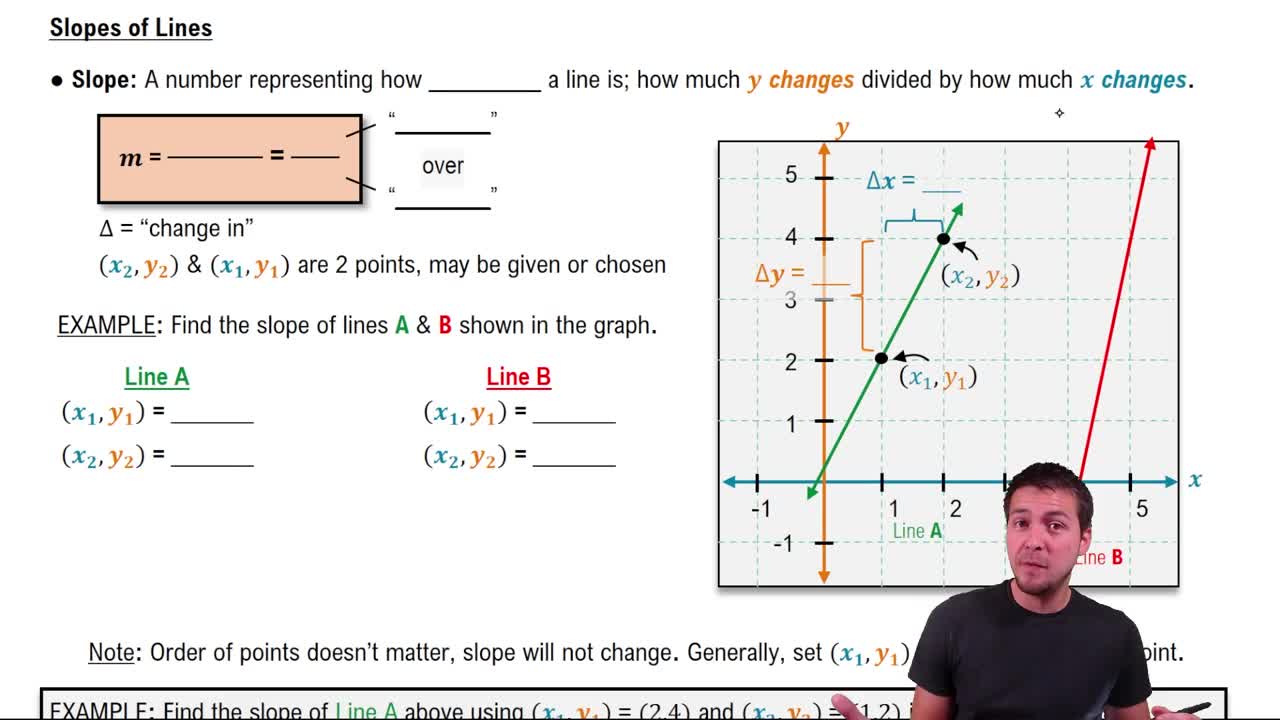
1
Recall the vertical line test: A graph represents y as a function of x if and only if no vertical line intersects the graph at more than one point.
Observe the given graph, which is a straight line sloping downward crossing both the x-axis and y-axis.
Imagine drawing vertical lines (lines parallel to the y-axis) at various x-values along the graph.
Check if any vertical line intersects the graph at more than one point. Since this is a straight line, each vertical line will intersect it at exactly one point.
Conclude that since every vertical line intersects the graph at only one point, the graph passes the vertical line test, so y is a function of x.

Verified video answer for a similar problem:

This video solution was recommended by our tutors as helpful for the problem above.
Video duration:
45s
Was this helpful?

Key Concepts

Here are the essential concepts you must grasp in order to answer the question correctly.

Vertical Line Test

The vertical line test is a method used to determine if a graph represents a function. If any vertical line drawn through the graph intersects it at more than one point, the graph does not represent a function. This test ensures that each input (x-value) has only one output (y-value).
Recommended video:
Guided course
06:49
The Slope of a Line

Definition of a Function

A function is a relation where each input value (x) corresponds to exactly one output value (y). This means no x-value can be paired with multiple y-values. Understanding this definition is crucial to identifying functions from graphs.
Recommended video:
5:57
Graphs of Common Functions

Graph of a Linear Function

A linear function is represented by a straight line on the coordinate plane. Since a line passes the vertical line test (no vertical line intersects it more than once), it always represents a function. The graph shown is a downward sloping line, indicating a linear function with a negative slope.
Recommended video:
5:26
Graphs of Logarithmic Functions