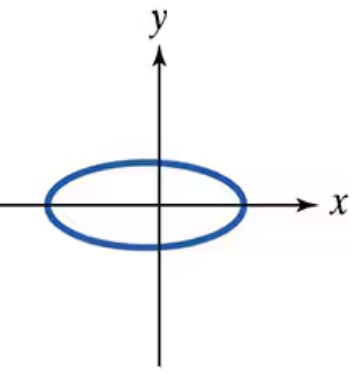
Ch. 2 - Functions and Graphs
Blitzer - College Algebra 8th Edition
Blitzer8th EditionCollege AlgebraISBN: 9780136970514Not the one you use?Change textbook
Chapter 3, Problem 59

Use the vertical line test to identify graphs in which y is a function of x.

Verified step by step guidance
1
Recall that the vertical line test is used to determine if a graph represents a function. According to this test, if any vertical line intersects the graph at more than one point, then the graph does not represent y as a function of x.
Observe the given graph, which is an oval shape (an ellipse) centered roughly around (-5, 5) on the coordinate plane.
Imagine drawing vertical lines (lines parallel to the y-axis) at various x-values across the graph. Notice that for many x-values within the range of the oval, the vertical line will intersect the oval at two points: one on the upper half and one on the lower half of the oval.
Since there are vertical lines that intersect the graph at more than one point, this means that for some x-values, there are multiple corresponding y-values.
Therefore, based on the vertical line test, the graph does not represent y as a function of x.

Verified video answer for a similar problem:

This video solution was recommended by our tutors as helpful for the problem above.
Video duration:
45s
Was this helpful?

Key Concepts

Here are the essential concepts you must grasp in order to answer the question correctly.

Vertical Line Test

The vertical line test is a method used to determine if a graph represents a function. If any vertical line drawn through the graph intersects it at more than one point, the graph does not represent a function because a single input (x-value) corresponds to multiple outputs (y-values).
Recommended video:
Guided course
06:49
The Slope of a Line

Definition of a Function

A function is a relation where each input (x-value) has exactly one output (y-value). This means no x-value can be paired with more than one y-value. Understanding this definition is essential to applying the vertical line test correctly.
Recommended video:
5:57
Graphs of Common Functions

Graph Interpretation

Interpreting graphs involves understanding the relationship between x and y coordinates. In the given image, the oval shape crosses some vertical lines more than once, indicating multiple y-values for a single x-value, which helps conclude whether the graph is a function.
Recommended video:
Guided course
02:16
Graphs and Coordinates - Example