Textbook Question
Use the graph of y = f(x) to graph each function g. g(x)=2f(x-1)

 Verified step by step guidance
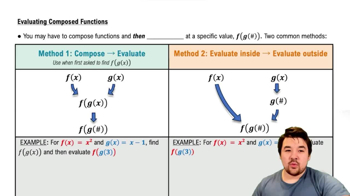
 4:26
4:26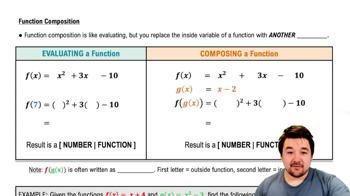 4:56
4:56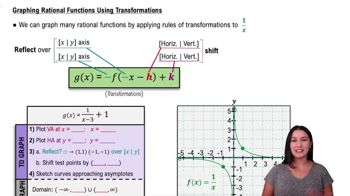 5:31
5:31Use the graph of y = f(x) to graph each function g. g(x)=2f(x-1)
Begin by graphing the standard quadratic function, f(x) = x². Then use transformations of this graph to graph the given function. g(x) = x² - 2
Find
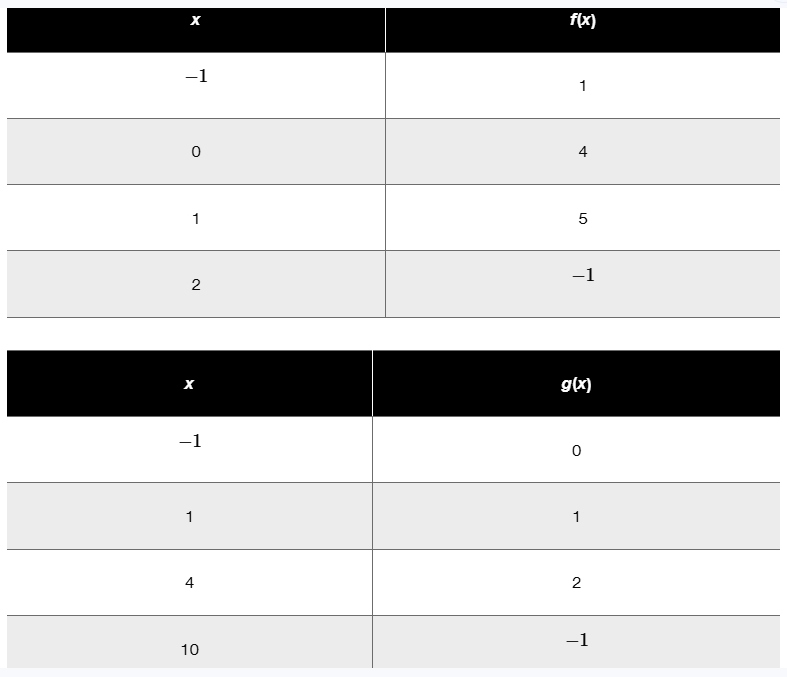
a. (fog) (x)
b. (go f) (x)
c. (fog) (2)
d. (go f) (2).
f(x) = x+4, g(x) = 2x + 1
In Exercises 51–54, graph the given square root functions, f and g, in the same rectangular coordinate system. Use the integer values of x given to the right of each function to obtain ordered pairs. Because only nonnegative numbers have square roots that are real numbers, be sure that each graph appears only for values of x that cause the expression under the radical sign to be greater than or equal to zero. Once you have obtained your graphs, describe how the graph of g is related to the graph of f. f(x) = √x (x = 0, 1, 4, 9) and g(x) = √x −1 (x = 0, 1, 4, 9)
Complete the square and write the equation in standard form. Then give the center and radius of each circle and graph the equation. x² + y²+6x+2y+6 = 0
In Exercises 39-52, a. Find an equation for ƒ¯¹(x). b. Graph ƒ and ƒ¯¹(x) in the same rectangular coordinate system. c. Use interval notation to give the domain and the range off and ƒ¯¹. f(x) = ∛x + 1