Textbook Question
Use the vertical line test to identify graphs in which y is a function of x.

 Verified step by step guidance
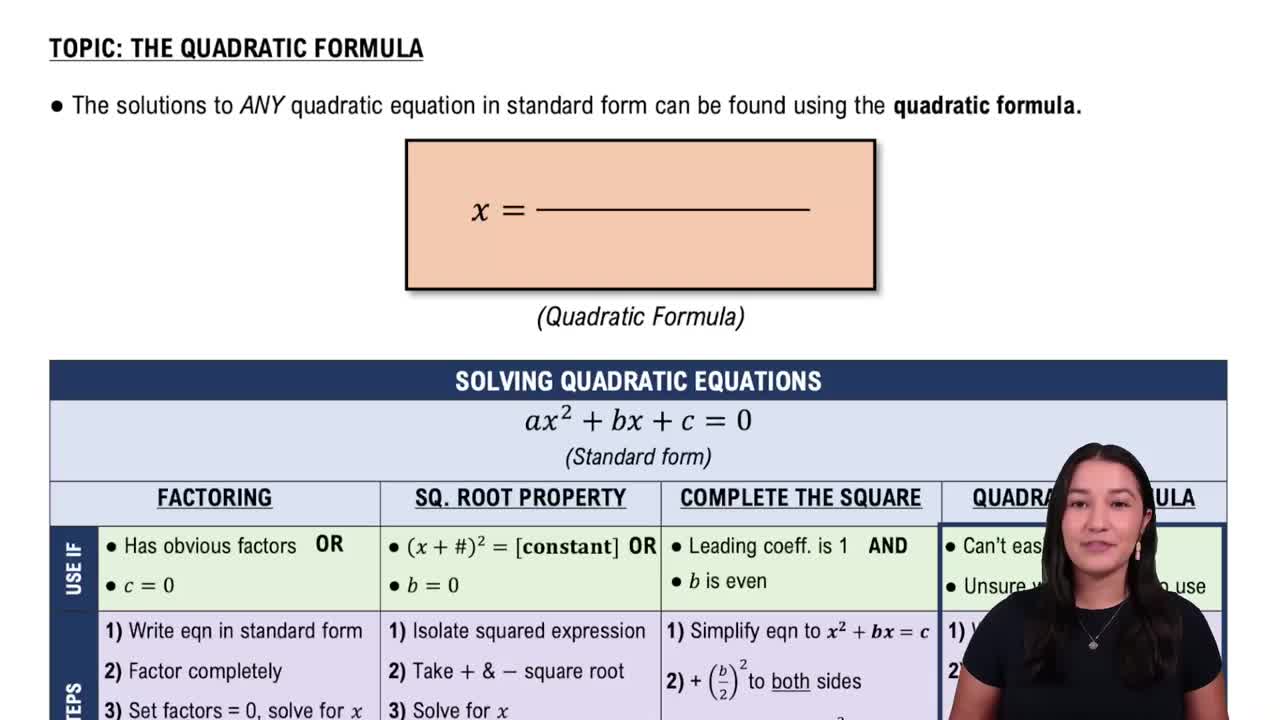
 06:36
06:36 5:48
5:48 4:47
4:47Use the vertical line test to identify graphs in which y is a function of x.
Find the average rate of change of the function from x1 to x2. f(x) = 3x from x1 = 0 to x2 = 5
Use the graph of y = f(x) to graph each function g.
g(x) = f(x/2)
Use the graph of y = f(x) to graph each function g.
g(x) = 2f(x)
Use the given conditions to write an equation for each line in point-slope form and general form. Passing through (5, −9) and perpendicular to the line whose equation is x + 7y - 12= 0
The functions in Exercises 11-28 are all one-to-one. For each function, a. Find an equation for f-1(x), the inverse function. b. Verify that your equation is correct by showing that f(ƒ-1 (x)) = = x and ƒ-1 (f(x)) = x. f(x) = 2x