Ch. 2 - Functions and Graphs
Blitzer - College Algebra 8th Edition
Blitzer8th EditionCollege AlgebraISBN: 9780136970514Not the one you use?Change textbook
Chapter 3, Problem 12

Use the graph of y = f(x) to graph each function g.

g(x) = 2f(x)

Verified step by step guidance
1
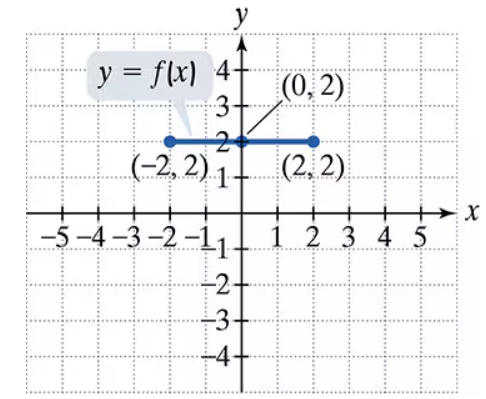
Step 1: Observe the graph of y = f(x). It is a horizontal line segment from (1, -3) to (4, -3), meaning the function f(x) is constant and equal to -3 for all x in the interval [1, 4].
Step 2: Understand the transformation g(x) = 2f(x). This means that the values of f(x) are multiplied by 2 to produce g(x). Mathematically, g(x) = 2 * (-3) = -6 for all x in the interval [1, 4].
Step 3: Determine the new graph of g(x). Since g(x) is constant and equal to -6, the graph of g(x) will also be a horizontal line segment, but at y = -6 instead of y = -3.
Step 4: Plot the new line segment for g(x). The endpoints of the line segment will remain the same in terms of x-coordinates, so the new line segment will extend from (1, -6) to (4, -6).
Step 5: Label the graph appropriately. Indicate that the new graph represents g(x) = 2f(x), and ensure the horizontal line segment is clearly drawn at y = -6 between x = 1 and x = 4.

Verified video answer for a similar problem:

This video solution was recommended by our tutors as helpful for the problem above.
Video duration:
1m

Key Concepts

Here are the essential concepts you must grasp in order to answer the question correctly.

Function Transformation

Function transformation refers to the process of altering the graph of a function through various operations, such as vertical or horizontal shifts, stretches, or reflections. In this case, the function g(x) = 2f(x) represents a vertical stretch of the original function f(x) by a factor of 2, which means that every output value of f(x) is multiplied by 2.
Recommended video:
4:22
Domain & Range of Transformed Functions

Graphing Functions

Graphing functions involves plotting points on a coordinate plane based on the function's input-output relationship. For the function g(x) = 2f(x), the graph can be derived from the graph of f(x) by taking each y-coordinate of f(x) and multiplying it by 2, effectively doubling the height of the graph while keeping the x-coordinates the same.
Recommended video:
5:26
Graphs of Logarithmic Functions

Horizontal and Vertical Lines

Horizontal lines in a graph represent constant functions where the output value remains the same regardless of the input. In the provided graph, f(x) is a horizontal line at y = -3 between x = 1 and x = 4. When transforming this line to g(x) = 2f(x), the new line will be at y = -6, maintaining its horizontal nature but at a different vertical position.
Recommended video:
06:49
The Slope of a Line