Textbook Question
57–64. Graphing polar curves Graph the following equations. Use a graphing utility to check your work and produce a final graph.
r² = 4 sin θ

 Verified step by step guidance
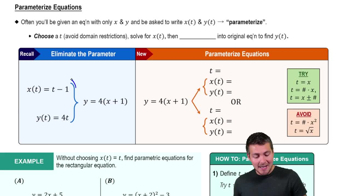
 08:02
08:02 05:02
05:02 06:49
06:4957–64. Graphing polar curves Graph the following equations. Use a graphing utility to check your work and produce a final graph.
r² = 4 sin θ
Circles in general Show that the polar equation
r² - 2r r₀ cos(θ - θ₀) = R² - r₀²
describes a circle of radius R whose center has polar coordinates (r₀, θ₀)
63–66. Tracing hyperbolas and parabolas Graph the following equations. Then use arrows and labeled points to indicate how the curve is generated as θ increases from 0 to 2π.
r = 3/(1 - cos θ)
9–13. Graph the points with the following polar coordinates. Give two alternative representations of the points in polar coordinates.
(-1, -π/3)
45–60. Areas of regions Find the area of the following regions.
The region inside the rose r = 4 sin 2θ and inside the circle r = 2
37–52. Curves to parametric equations Find parametric equations for the following curves. Include an interval for the parameter values. Answers are not unique.
The left half of the parabola y=x ² +1, originating at (0, 1)