Textbook Question
Use the graph of f in the figure to find the following values or state that they do not exist. If a limit does not exist, explain why. <IMAGE>
1
views

 Verified step by step guidance
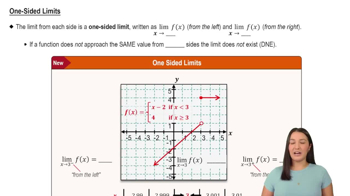
 05:50
05:50 6:04
6:04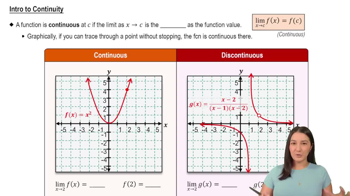 05:34
05:34Use the graph of f in the figure to find the following values or state that they do not exist. If a limit does not exist, explain why. <IMAGE>
Use the graph of f in the figure to find the following values or state that they do not exist. If a limit does not exist, explain why. <IMAGE>
d.
Use the graph of f in the figure to find the following values or state that they do not exist. If a limit does not exist, explain why. <IMAGE>
a. f(1)
Use the graph of f in the figure to find the following values or state that they do not exist. If a limit does not exist, explain why. <IMAGE>
Use the graph of f in the figure to find the following values or state that they do not exist. If a limit does not exist, explain why. <IMAGE>
h.
Determine the intervals of continuity for the parking cost function c introduced at the outset of this section (see figure). Consider 0≤t≤60. <FIGURE>