Textbook Question
Witch of Agnesi Let y(x²+4)=8 (see figure). <IMAGE>
d. Verify that the results of parts (a) and (c) are consistent.

 Verified step by step guidance
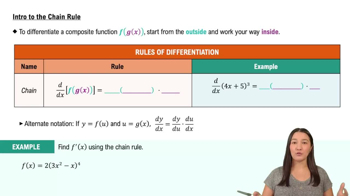
 05:02
05:02 04:22
04:22 3:48
3:48Witch of Agnesi Let y(x²+4)=8 (see figure). <IMAGE>
d. Verify that the results of parts (a) and (c) are consistent.
97–100. Logistic growth Scientists often use the logistic growth function P(t) = P₀K / P₀+(K−P₀)e^−r₀t to model population growth, where P₀ is the initial population at time t=0, K is the carrying capacity, and r₀ is the base growth rate. The carrying capacity is a theoretical upper bound on the total population that the surrounding environment can support. The figure shows the sigmoid (S-shaped) curve associated with a typical logistic model. <IMAGE>
{Use of Tech} Gone fishing When a reservoir is created by a new dam, 50 fish are introduced into the reservoir, which has an estimated carrying capacity of 8000 fish. A logistic model of the fish population is P(t) = 400,000 / 50+7950e^−0.5t, where t is measured in years.
d. Graph P' and use the graph to estimate the year in which the population is growing fastest.
Derivatives using tables Let and . Use the table to compute the following derivatives.
<IMAGE>
e.
Derivatives of inverse functions from a table Use the following tables to determine the indicated derivatives or state that the derivative cannot be determined. <IMAGE>
d. f'(1)
The table gives the position s(t)of an object moving along a line at time t, over a two-second interval. Find the average velocity of the object over the following intervals. <IMAGE>
a.
Let f(x) = sin x. What is the value of f′(π)?