Textbook Question
Use the graphs of ƒ and g in the figure to determine the following function values. y = f(x) ; y=g(x) <IMAGE>
c. ƒ(g (4))

 Verified step by step guidance
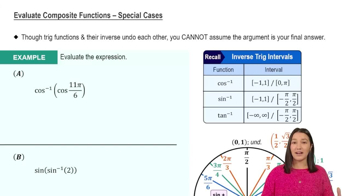
 3:48
3:48 4:26
4:26 06:15
06:15Use the graphs of ƒ and g in the figure to determine the following function values. y = f(x) ; y=g(x) <IMAGE>
c. ƒ(g (4))
Use the graphs of ƒ and g in the figure to determine the following function values. y = f(x) ; y=g(x) <IMAGE>
e. ƒ(ƒ(8))
Use the graphs of ƒ and g in the figure to determine the following function values. y = f(x) ; y=g(x) <IMAGE>
a. (ƒ o g ) (2)
Evaluate cos⁻¹(cos(5π/4)).
Use the graphs of ƒ and g in the figure to determine the following function values. y = f(x) ; y=g(x) <IMAGE>
d. g(ƒ(5))
Use the graph of in the figure to plot the following functions.
<IMAGE>