Ch. 4 - Graphs of the Circular Functions
Lial - Trigonometry 12th Edition
Lial12th EditionTrigonometryISBN: 9780136552161Not the one you use?Change textbook
Chapter 5, Problem 4.39

Graph each function over a two-period interval. Give the period and amplitude. See Examples 2–5.
y = π sin πx

Verified step by step guidance
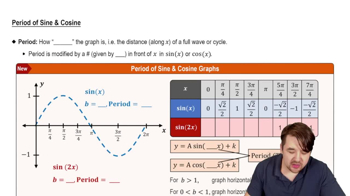
1
Identify the standard form of the sine function: \( y = a \sin(bx + c) + d \). In this case, \( a = \pi \), \( b = \pi \), \( c = 0 \), and \( d = 0 \).
Determine the amplitude of the function. The amplitude is the absolute value of \( a \), which is \( |\pi| = \pi \).
Calculate the period of the function. The period is given by \( \frac{2\pi}{b} \). Substitute \( b = \pi \) to find the period: \( \frac{2\pi}{\pi} = 2 \).
Graph the function over a two-period interval. Since the period is 2, a two-period interval is from \( x = 0 \) to \( x = 4 \).
Plot key points of the sine function within the interval, considering the amplitude and period. The key points occur at \( x = 0, 1, 2, 3, 4 \) with corresponding \( y \)-values calculated using \( y = \pi \sin(\pi x) \).

Verified video answer for a similar problem:

This video solution was recommended by our tutors as helpful for the problem above.
Was this helpful?

Key Concepts

Here are the essential concepts you must grasp in order to answer the question correctly.

Period of a Trigonometric Function

The period of a trigonometric function is the length of one complete cycle of the wave. For the sine function, the standard period is 2π. However, when the function is modified, such as in y = π sin(πx), the period can be calculated by dividing the standard period by the coefficient of x, which in this case is π. Thus, the period of this function is 2.
Recommended video:
5:33
Period of Sine and Cosine Functions

Amplitude of a Trigonometric Function

The amplitude of a trigonometric function refers to the maximum distance the function reaches from its midline. For the sine function, the amplitude is determined by the coefficient in front of the sine term. In the function y = π sin(πx), the amplitude is π, indicating that the graph will oscillate between π and -π.
Recommended video:
6:04
Introduction to Trigonometric Functions

Graphing Trigonometric Functions

Graphing trigonometric functions involves plotting the values of the function over a specified interval. For y = π sin(πx), one would plot points for x values within a two-period interval, which is from 0 to 4. The graph will exhibit a wave-like pattern, reflecting the calculated period and amplitude, allowing for visual interpretation of the function's behavior.
Recommended video:
6:04
Introduction to Trigonometric Functions