Textbook Question
Graph each function over the interval [-2π, 2π]. Give the amplitude. See Example 1.
y = 2 cos x
 Verified step by step guidance
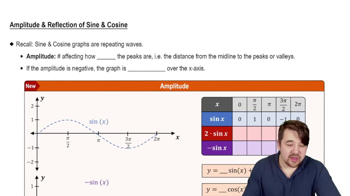
 5:05
5:05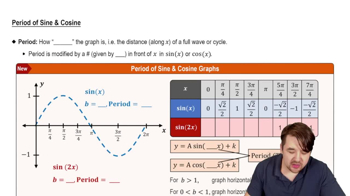 5:33
5:33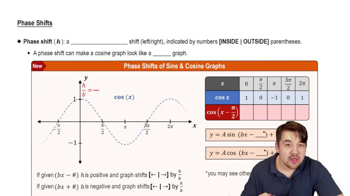 6:31
6:31Graph each function over the interval [-2π, 2π]. Give the amplitude. See Example 1.
y = 2 cos x
Fill in the blank(s) to correctly complete each sentence.
The graph of y = 6 + 3 sin x is obtained by shifting the graph of y = 3 sin x ________ unit(s) __________ (up/down).
Graph each function over a two-period interval. Give the period and amplitude. See Examples 2–5.
y = 2 sin ¼ x
Graph each function over a two-period interval. Give the period and amplitude. See Examples 2–5.
y = π sin πx
For each function, give the amplitude, period, vertical translation, and phase shift, as applicable.
y = tan 3x
Fill in the blank(s) to correctly complete each sentence.
The graph of y = -5 + 2 cos x is obtained by shifting the graph of y = 2 cos x ________ unit(s) __________ (up/down).