Ch. R - Algebra Review
Lial - Trigonometry 12th Edition
Lial12th EditionTrigonometryISBN: 9780136552161Not the one you use?Change textbook
Chapter 1, Problem 3

Fill in the blank(s) to correctly complete each sentence.
The graph of ƒ(x) = (x + 4)² is obtained by shifting the graph of y = x² to the ___ 4 units.

Verified step by step guidance
1
Identify the base function: The given function is \( f(x) = (x + 4)^2 \), which is a transformation of the parent function \( y = x^2 \).
Recall the effect of horizontal shifts on the graph of \( y = x^2 \): Replacing \( x \) with \( x + h \) shifts the graph horizontally by \( h \) units.
Determine the direction of the shift: Since the function is \( (x + 4)^2 \), the graph shifts horizontally to the left by 4 units (because adding inside the parentheses moves the graph left).
Write the completed sentence: The graph of \( f(x) = (x + 4)^2 \) is obtained by shifting the graph of \( y = x^2 \) to the left 4 units.
Understand that horizontal shifts do not affect the shape of the parabola, only its position along the x-axis.

Verified video answer for a similar problem:

This video solution was recommended by our tutors as helpful for the problem above.
Video duration:
2m

Key Concepts

Here are the essential concepts you must grasp in order to answer the question correctly.

Function Transformations

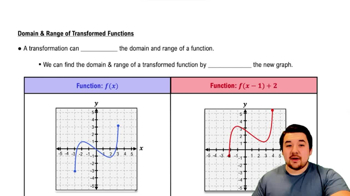
Function transformations involve shifting, stretching, or reflecting the graph of a base function. In this case, adding a constant inside the function's argument shifts the graph horizontally. Understanding how these changes affect the graph is essential for interpreting and sketching functions.
Recommended video:
4:22
Domain and Range of Function Transformations

Horizontal Shifts in Quadratic Functions

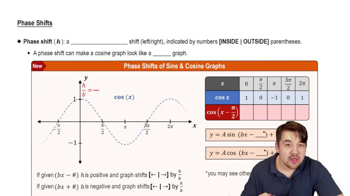
A horizontal shift occurs when a constant is added or subtracted inside the function's input, such as (x + h)². Specifically, f(x) = (x + 4)² shifts the graph of y = x² horizontally by 4 units. The sign inside the parentheses determines the direction of the shift.
Recommended video:
6:31
Phase Shifts

Graph of the Basic Quadratic Function y = x²

The graph of y = x² is a parabola centered at the origin with its vertex at (0,0). It opens upwards and is symmetric about the y-axis. Recognizing this base graph helps in understanding how transformations like shifts affect its position.
Recommended video:
6:22
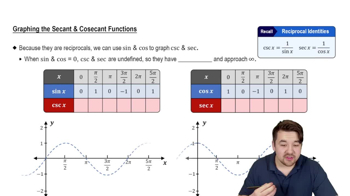
Graphs of Secant and Cosecant Functions