Ch. 5 - Discrete Probability Distributions
Triola - Elementary Statistics 14th Edition
Triola14th EditionElementary StatisticsISBN: 9780137366446Not the one you use?Change textbook
Chapter 5, Problem 24d

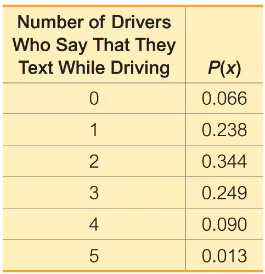
Texting and Driving. In Exercises 21–26, refer to the accompanying table, which describes probabilities for groups of five drivers. The random variable x is the number of drivers in a group who say that they text while driving (based on data from an Arity survey of drivers).
tab2
Using Probabilities for Significant Events
d. Is 3 a significantly high number of drivers who say that they text while driving? Why or why not?

Verified step by step guidance
1
Step 1: Understand the problem. We are tasked with determining whether 3 drivers who say they text while driving is a significantly high number. To do this, we need to use the probabilities provided in the table and apply statistical concepts such as the mean, standard deviation, and the rule for identifying significant values.
Step 2: Calculate the mean (μ) of the distribution. The mean of a probability distribution is calculated using the formula: μ = Σ(x * P(x)), where x is the number of drivers and P(x) is the probability associated with x.
Step 3: Calculate the standard deviation (σ) of the distribution. The formula for the standard deviation is: σ = √Σ((x - μ)^2 * P(x)), where x is the number of drivers, μ is the mean, and P(x) is the probability associated with x.
Step 4: Apply the rule for identifying significant values. A value is considered significantly high if it is greater than μ + 2σ. Substitute the calculated mean and standard deviation into this inequality to determine whether 3 is significantly high.
Step 5: Compare the value of 3 to the threshold μ + 2σ. If 3 exceeds this threshold, it is considered significantly high. Otherwise, it is not. Use the calculated values from Steps 2 and 3 to make this determination.

Verified video answer for a similar problem:

This video solution was recommended by our tutors as helpful for the problem above.
Video duration:
2m
Was this helpful?

Key Concepts

Here are the essential concepts you must grasp in order to answer the question correctly.

Random Variable

A random variable is a numerical outcome of a random phenomenon. In this context, the random variable x represents the number of drivers in a group of five who report texting while driving. Understanding random variables is crucial for analyzing probabilities and making inferences about the data collected.
Recommended video:
Guided course
07:09
Intro to Random Variables & Probability Distributions

Probability Distribution

A probability distribution describes how probabilities are assigned to each possible value of a random variable. The table provided shows the probability distribution for the random variable x, indicating the likelihood of each number of drivers (0 to 5) texting while driving. This distribution is essential for determining whether a specific outcome, like x=3, is significant.
Recommended video:
Guided course
06:39
Calculating Probabilities in a Binomial Distribution

Significance in Statistics

In statistics, significance refers to the likelihood that a result or relationship is caused by something other than mere random chance. To determine if 3 drivers texting while driving is significantly high, one would compare its probability to a threshold, often using the cumulative probabilities from the distribution to assess how unusual this outcome is within the context of the data.
Recommended video:
Guided course
05:53
Parameters vs. Statistics