Textbook Question
ESP A psychologist tells you that in an ESP (extrasensory perception) experiment, there is a 20% chance of answering a question correctly. What is the probability of answering a question correctly?

 Verified step by step guidance
 5:37
5:37 06:00
06:00 04:04
04:04ESP A psychologist tells you that in an ESP (extrasensory perception) experiment, there is a 20% chance of answering a question correctly. What is the probability of answering a question correctly?
Standard Tests Standard tests, such as the SAT or ACT or MCAT, tend to make extensive use of multiple-choice questions because they are easy to grade using software. If one such multiple choice question has possible correct answers of a, b, c, d, e, what is the probability of a wrong answer if the answer is a random guess?
Births in the United States In the United States, the true probability of a baby being a boy is 0.512 (based on the data available at this writing). For a family having three children, find the following.
d. The probability that at least one of the children is a girl.
Sampling Eye Color Based on a study by Dr. P. Sorita Soni at Indiana University, assume that eye colors in the United States are distributed as follows: 40% brown, 35% blue, 12% green, 7% gray, 6% hazel.
d. If two people are randomly selected, what is the probability that at least one of them has brown eyes?
Subjective Probability Estimate the probability that the next time you watch a TV news report, it includes a story about a plane crash.
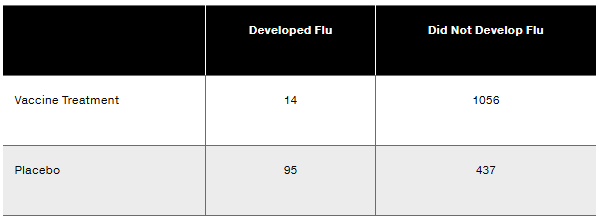
In Exercises 6–10, use the following results from tests of an experiment to test the effectiveness of an experimental vaccine for children (based on data from USA Today). Express all probabilities in decimal form.
If 1 of the 1602 subjects is randomly selected, find the probability of getting 1 that developed flu.