


 06:28
06:28
Textbook Question
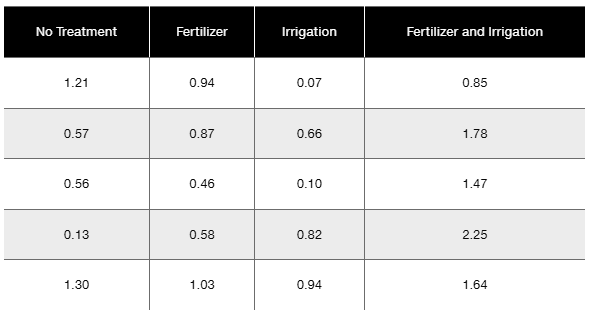
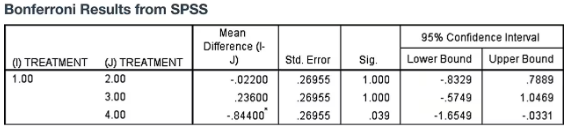
Bonferroni Test Shown below are weights (kg) of poplar trees obtained from trees planted in a rich and moist region. The trees were given different treatments identified in the table below. The data are from a study conducted by researchers at Pennsylvania State University and were provided by Minitab, Inc. Also shown are partial results from using the Bonferroni test with the sample data.
a. Use a 0.05 significance level to test the claim that the different treatments result in the same mean weight.
1
views