Textbook Question
Testing Goodness-of-Fit with a Normal Distribution Refer to Data Set 1 “Body Data” in Appendix B for the heights of females.
" style="" width="600">
a. Enter the observed frequencies in the table above.
1
views

 Verified step by step guidance
 04:14 04:14
Testing Goodness-of-Fit with a Normal Distribution Refer to Data Set 1 “Body Data” in Appendix B for the heights of females.
" style="" width="600">
a. Enter the observed frequencies in the table above.
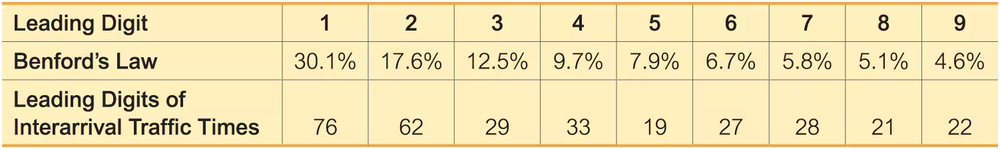
Cybersecurity The table below lists the frequency of leading digits of Internet traffic interarrival times for a computer, along with the percentages of each leading digit expected with Benford’s law.
a. Identify the general notation used for observed and expected values.
" style="" width="650">
Testing Goodness-of-Fit with a Normal Distribution Refer to Data Set 1 “Body Data” in Appendix B for the heights of females.
" style="max-width: 100%; white-space-collapse: preserve;" width="600">
c. Using the probabilities found in part (b), find the expected frequency for each category.
Testing Goodness-of-Fit with a Normal Distribution Refer to Data Set 1 “Body Data” in Appendix B for the heights of females.
" style="max-width: 100%; white-space-collapse: preserve;" width="600">
b. Assuming a normal distribution with mean and standard deviation given by the sample mean and standard deviation, use the methods of Chapter 6 to find the probability of a randomly selected height belonging to each class.
Exercises 1–5 refer to the sample data in the following table, which summarizes the frequencies of 500 digits randomly generated by Statdisk. Assume that we want to use a 0.05 significance level to test the claim that Statdisk generates the digits in a way that they are equally likely.
What are the null and alternative hypotheses corresponding to the stated claim?
Cybersecurity The table below lists the frequency of leading digits of Internet traffic interarrival times for a computer, along with the percentages of each leading digit expected with Benford’s law.
c. Use the results from part (b) to find the contribution to the x2 test statistic from the category representing the leading digit of 2.
" style="max-width: 100%; white-space-collapse: preserve;" width="650">