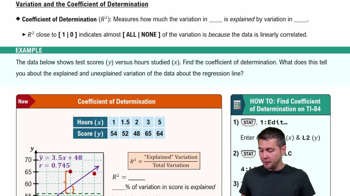
Ch. 9 - Correlation and Regression
Larson - Elementary Statistics: Picturing the World 8th Edition
Larson8th EditionElementary Statistics: Picturing the WorldISBN: 9780137493470Not the one you use?Change textbook
Chapter 9, Problem 9.R.27

"In Exercises 27 and 28, use the multiple regression equation to predict the y-values for the values of the independent variables.
27. An equation that can be used to predict fuel economy (in miles per gallon) for automobiles is
y=41.3- 0.004x_1 - 0.0049x_2
where x_1 is the engine displacement (in cubic inches) and x_2 is the vehicle weight (in
pounds).
a. x_1 = 305, x_2 = 3750
b. x_1 = 225, x_2 = 3100
c. x_1 = 105, x_2 = 2200
d. x_1 = 185, x_2 = 3000"

Verified step by step guidance
1
Identify the multiple regression equation given: y = 41.3 - 0.004x1 - 0.0049x2, where x1 is engine displacement and x2 is vehicle weight.
For each set of values of x1 and x2, substitute these values into the regression equation. For example, for part (a), substitute 305 for x1 and 3750 for x2.
Perform the multiplication for each term involving the independent variables: multiply 0.004 by x1 and 0.0049 by x2.
Subtract the results of these multiplications from the constant term 41.3 to find the predicted value of y (fuel economy) for each case.
Repeat steps 2 to 4 for each set of values given in parts (b), (c), and (d) to find all predicted fuel economy values.

Verified video answer for a similar problem:

This video solution was recommended by our tutors as helpful for the problem above.
Video duration:
2m
Was this helpful?

Key Concepts

Here are the essential concepts you must grasp in order to answer the question correctly.

Multiple Regression Equation

A multiple regression equation models the relationship between one dependent variable and two or more independent variables. It predicts the dependent variable by combining the independent variables, each multiplied by their respective coefficients, plus a constant term. This allows for understanding how changes in predictors affect the outcome.
Recommended video:
Guided course
07:01
Intro to Least Squares Regression

Interpretation of Regression Coefficients

Regression coefficients represent the expected change in the dependent variable for a one-unit increase in an independent variable, holding other variables constant. Negative coefficients indicate an inverse relationship, meaning as the predictor increases, the predicted value decreases.
Recommended video:
Guided course
06:14
Coefficient of Determination

Prediction Using Regression Models

Prediction involves substituting given values of independent variables into the regression equation to calculate the estimated dependent variable. This process helps estimate outcomes based on known inputs, useful for forecasting or decision-making.
Recommended video:
Guided course
04:57
Using Regression Lines to Predict Values
Related Practice
Textbook Question

"In Exercises 17 and 18, use the data to (a) find the coefficient of determination r^2 and interpret

the result, and (b) find the standard error of estimate s_e and interpret the result.

17. The table shows the times (in seconds) to accelerate from 0 to 60 miles per hour and the top speeds (in miles per hour) for eight electric cars. The regression equation is y =- 14.399x + 196.996. (Source: Car and Driver)

Textbook Question

"In Exercises 19-24, construct the indicated prediction interval and interpret the results.

22. Construct a 95% prediction interval for the fuel efficiency of an automobile in Exercise 12 that has an engine displacement of 265 cubic inches."

Textbook Question

"In Exercises 13-16, use the value of the correlation coefficient r to calculate the coefficient of determination r^2. What does this tell you about the explained variation of the data about the regression line? about the unexplained variation?

14.r =- 0.937"

Textbook Question

"In Exercises 19-24, construct the indicated prediction interval and interpret the results.

20. Construct a 90% prediction interval for the average time adults ages 35 to 44 spend per day watching television in Exercise 10 when the average time adults ages 25 to 34 spend per day watching television is 2.25 hours."

Textbook Question

"In Exercises 19-24, construct the indicated prediction interval and interpret the results.

19. Construct a 90% prediction interval for the amount of milk produced in Exercise 9 when there are an average of 9275 thousand milk cows."

1
views
Textbook Question

"In Exercises 19-24, construct the indicated prediction interval and interpret the results.

23. Construct a 99% prediction interval for the top speed of an electric car in Exercise 17 that takes 5.9 seconds to accelerate from 0 to 60 miles per hour."