Textbook Question
Graphical Analysis In Exercises 9–12, state whether each standardized test statistic t allows you to reject the null hypothesis. Explain.
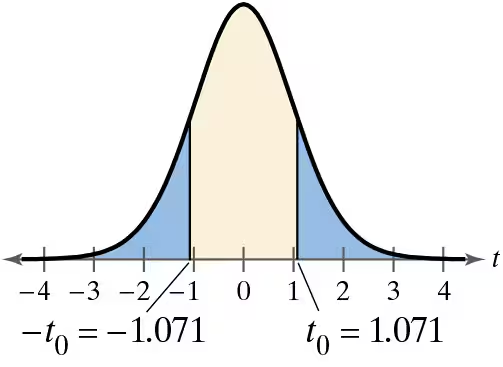
c. t = -2.096

 Verified step by step guidance
 06:21
06:21 06:34
06:34 05:50
05:50Graphical Analysis In Exercises 9–12, state whether each standardized test statistic t allows you to reject the null hypothesis. Explain.
c. t = -2.096
Interpreting a Decision In Exercises 43–48, determine whether the claim represents the null hypothesis or the alternative hypothesis. If a hypothesis test is performed, how should you interpret a decision that
b. fails to reject the null hypothesis?
Rent A recent study claims that at least 20% of renters are behind on rent payments in New Jersey.
Writing Hypotheses: Internet Provider An Internet provider is trying to gain advertising deals and claims that the mean time a customer spends online per day is greater than 28 minutes. You are asked to test this claim. How would you write the null and alternative hypotheses when
b. you represent a competing advertiser and want to reject the claim?
Graphical Analysis In Exercises 13 and 14, state whether each standardized test statistic X^2 allows you to reject the null hypothesis. Explain.
b. X^2=23.309